Tezos: This metric could be key to XTZ pushing towards $3

Disclaimer: The findings of the following analysis are the sole opinions of the writer and should not be taken as investment advice
Since falling to a 5-month low of $2.1 on 22 June, Tezos’s market has struggled to reclaim levels seen just after the 19 May crypto sell-off. Its most recent hike to $3.1 was countered by selling pressure which pulled it down to a press time value of $2.75. With low volatility in the market, Tezos could see some sideways movement over the next few sessions with slight chances of a breakout as well.
Tezos 4-hour chart
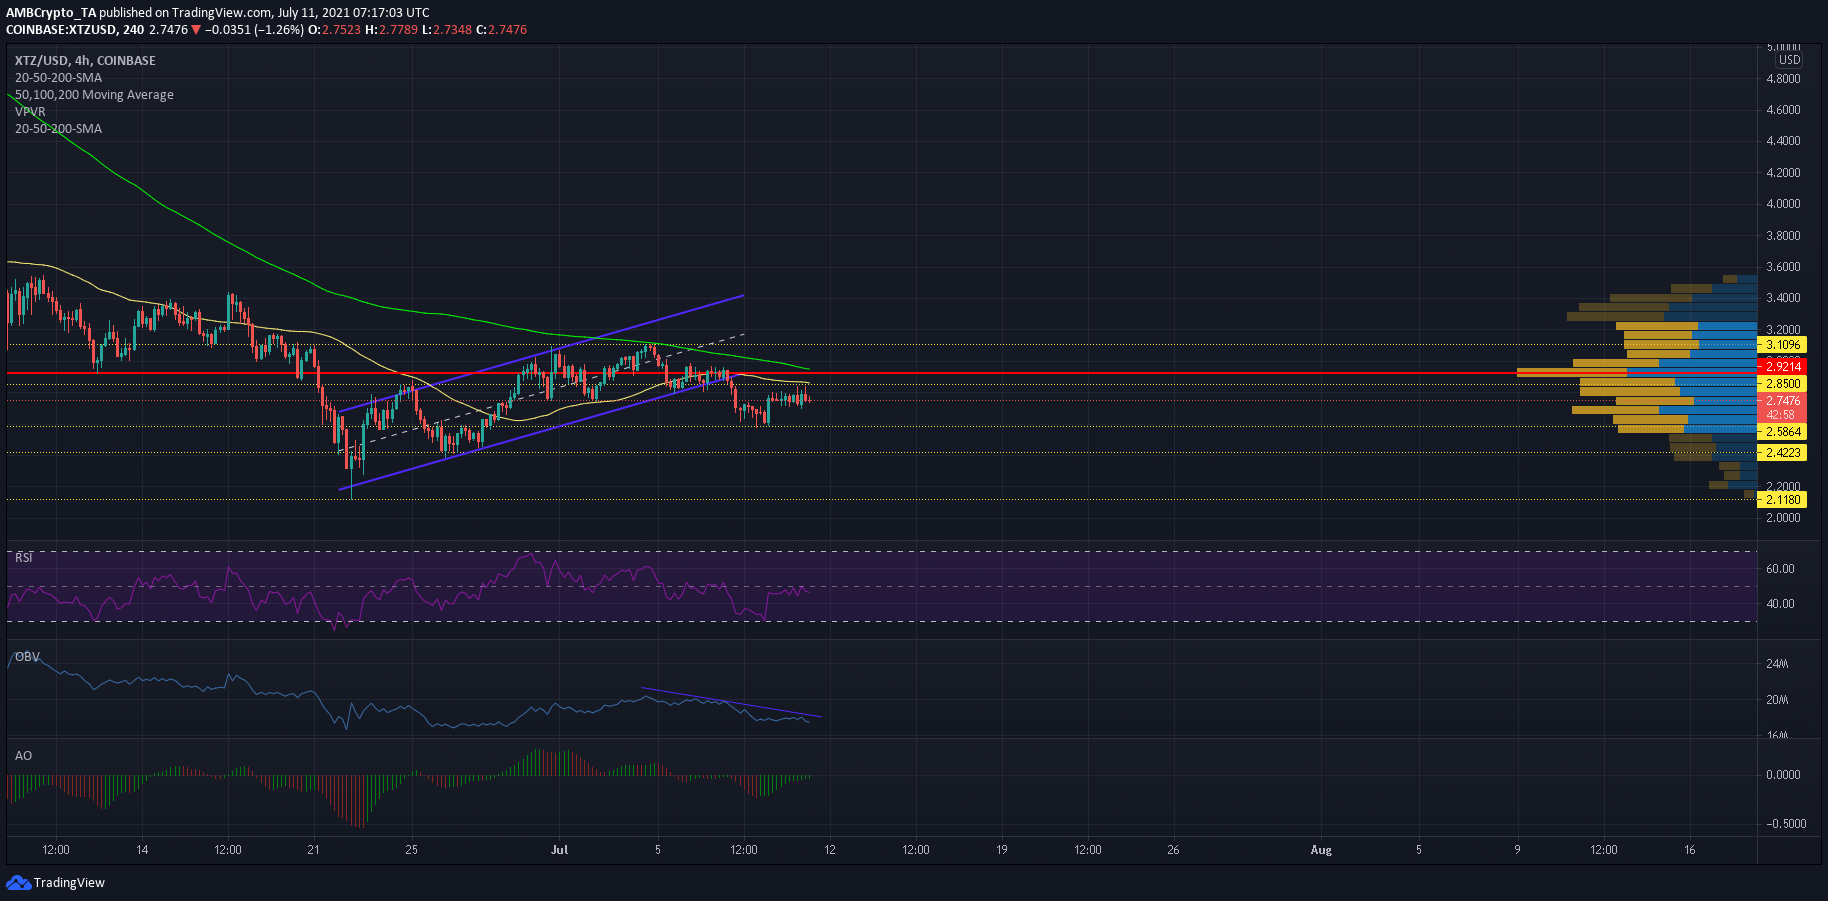
There were not many positive takeaways from Tezos’s chart. Its steady rise from $2.1 to $3.1 was its last big rally, but the 200-SMA (green), which has run bearish for nearly two months now, denied further upside. Once selling pressure returned to the market, XTZ broke south from its up-channel and found support at the defensive line of $2.58.
There were some attempts at another rally on 8 July, but the price failed to topple the 50-SMA (yellow) and $2.85 upper ceiling.
Reasoning
The Relative Strength Index bounced back from the oversold zone as Tezos’s bulls initiated a brief 6% hike back towards $2.85. However, the index had not yet risen above 50-55, which meant that bulls were yet to assume control. The On Balance Volume’s downward trajectory suggested that selling pressure was still a driving force in the market, although a rise above the upper trendline could denote some buying resurgence.
Finally, the Awesome Oscillator suggested that bullish momentum was on the up over the past few sessions.
Considering XTZ’s mixed bag of indicators, there were many uncertainties in the market. Since the 200-SMA, 50-SMA, and Visible Range’s POC of $2.9 all formed a strong resistance channel, a northbound push seemed unlikely. However, a close above the aforementioned levels would initiate a comeback towards $3.
Conclusion
Although some bullish momentum had seeped into the market, Tezos’s bulls faced an uphill task to rise above the strong resistance channel of $2.85-$2.92. Its near-term movement can be expected to be lateral, but a close eye should be kept on its 24-hour trading volumes. If the volumes continue to surge, there were chances of an upwards breakout- one that could push XTZ back towards the $3-figure.