Tezos [XTZ]: Taking a closer look at why a further 10% rally is on the cards for XTZ

Disclaimer: The findings of the following analysis are the sole opinions of the writer and should not be considered investment advice.
Bitcoin has been loath to give up the $30k level to bearish control, and at press time, a dip to $29.6k was swiftly bought up to push BTC back above $30k in the hours prior to press time. Tezos has been climbing steadily higher on the charts in recent days and has finally managed to beat the $2.2 resistance level.
This level has halted the progress of the bulls for a month now, but its retest as support has given the market a stronger bullish bias in the coming days.
XTZ- 1 Hour Chart
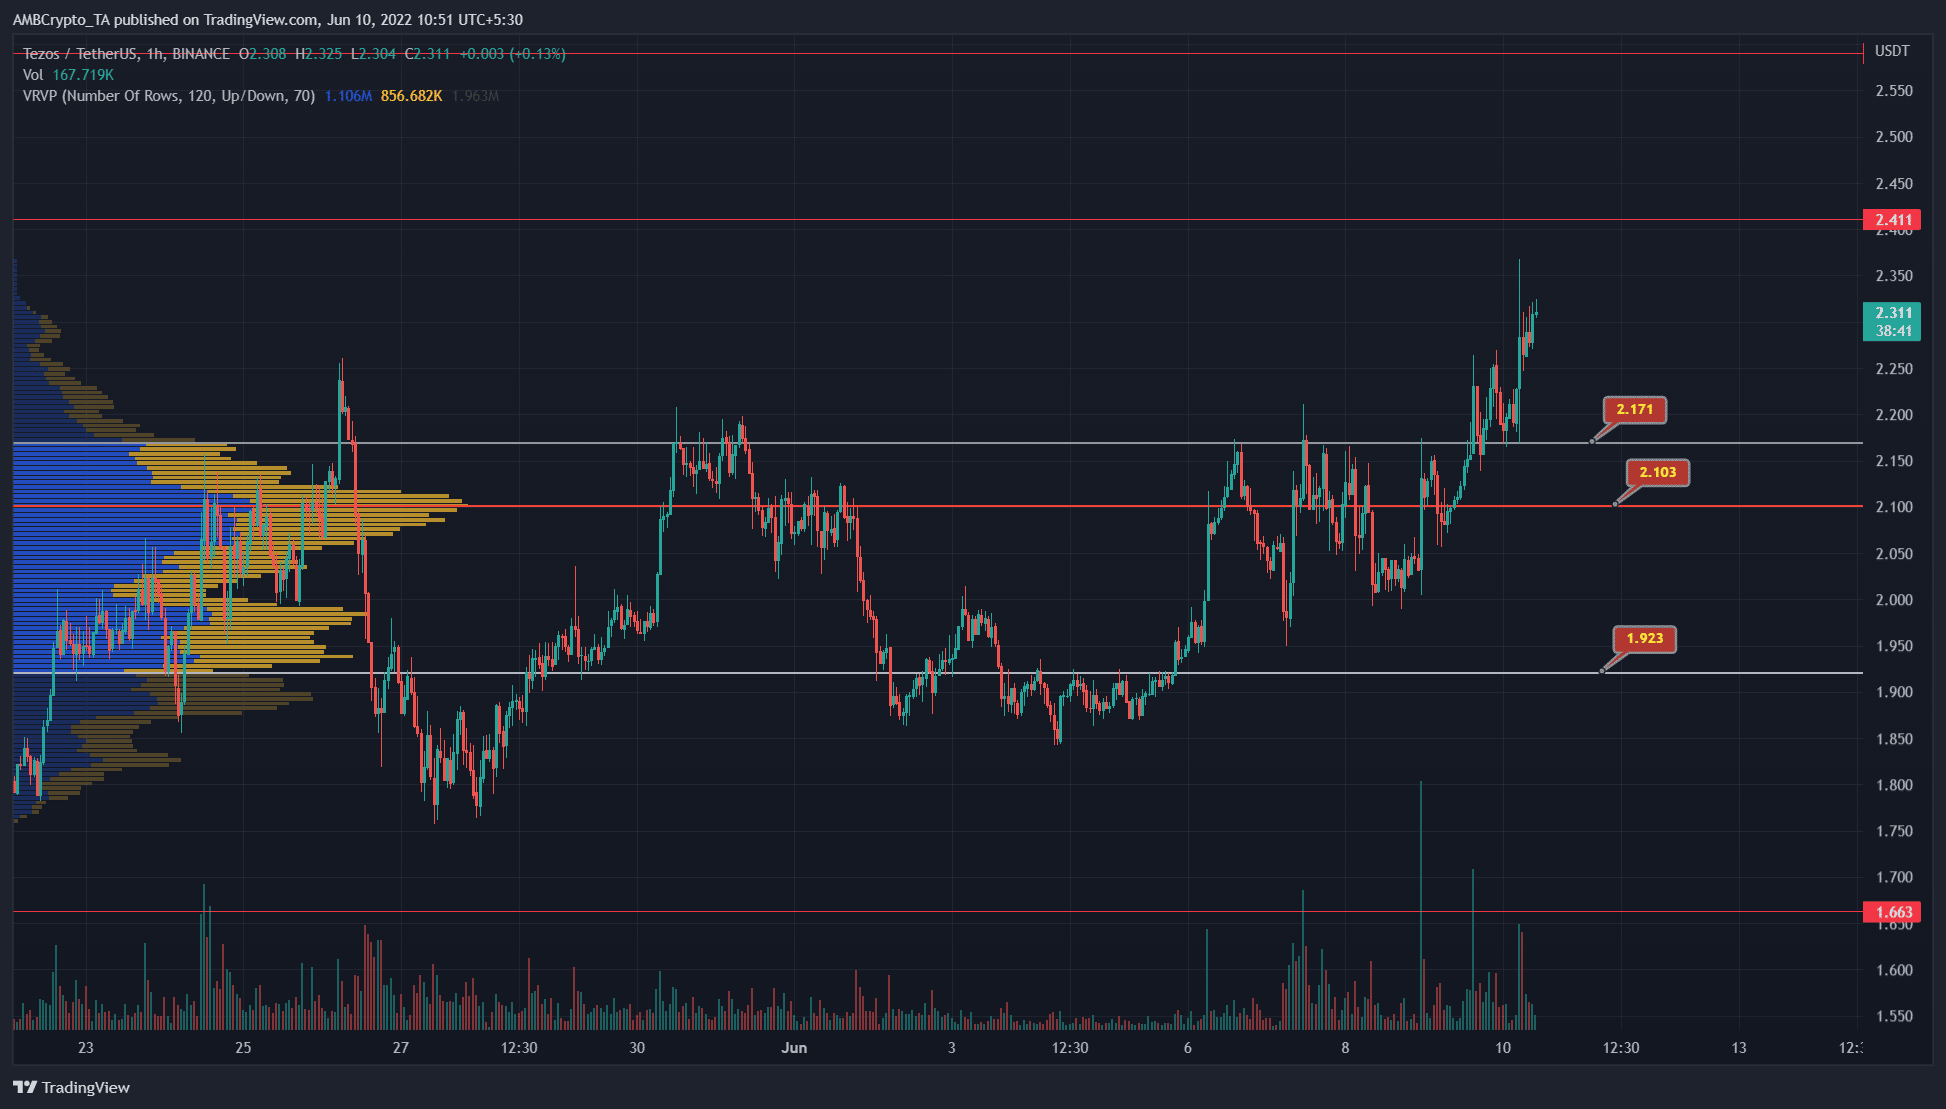
The Visible Range Volume Profile showed that the Point of Control lay at $2.1, and the Value Area Highs at $2.17. In the past two days of trading, the price has managed to climb past the $2.17 level and has also retested it as support.
This suggested that a strong move upward could be around the corner. The next levels of strong resistance lie at $2.41 and $2.59 to the north, which is around 7.5% and 15.1% above the $2.25 mark.
Rationale
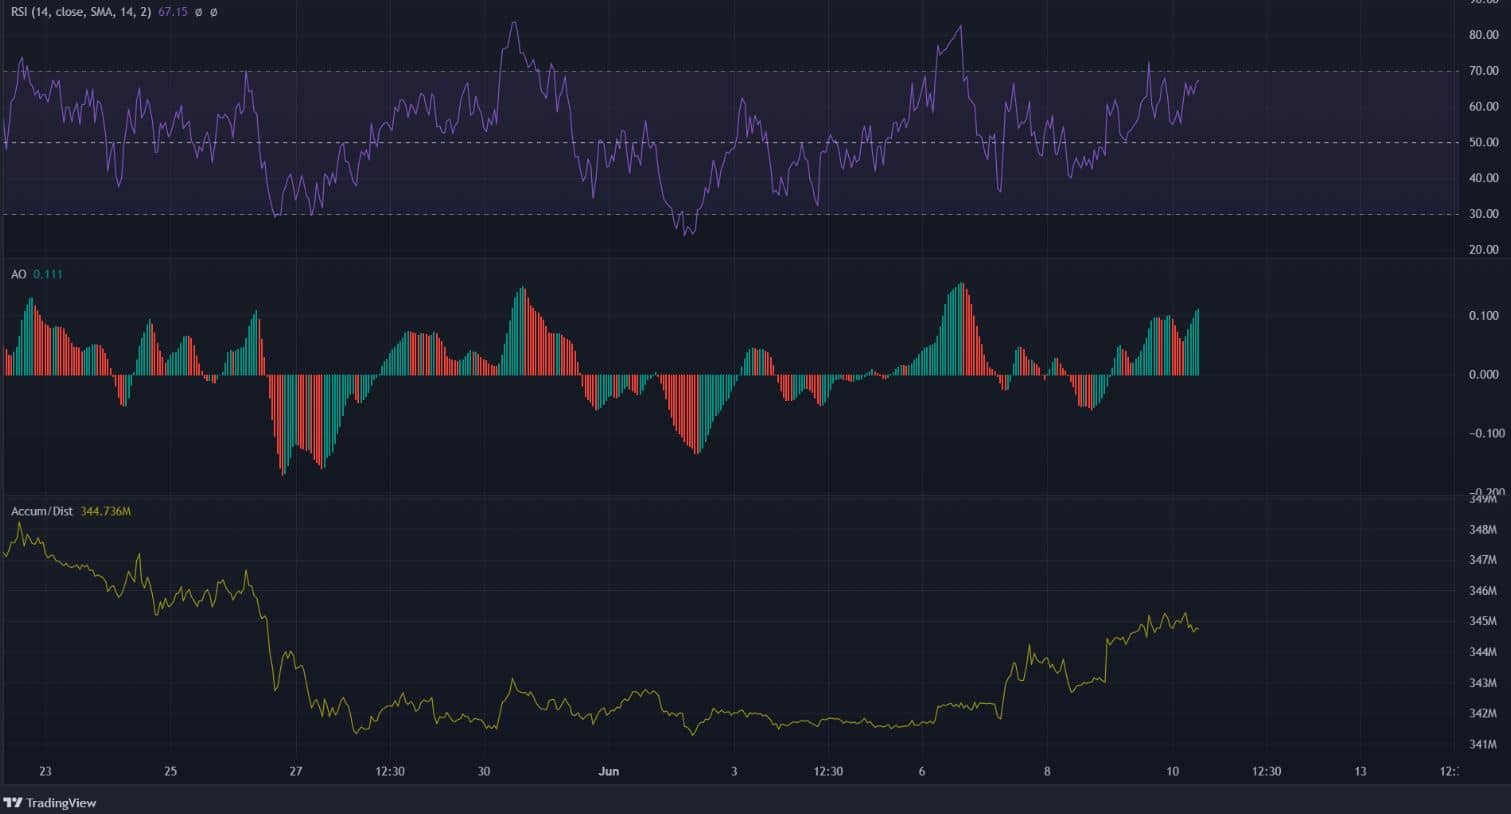
The momentum indicators showed strong bullish momentum on the lower timeframes. The RSI on the hourly chart stood at 67, while the Awesome Oscillator was also well above the zero line to show significant momentum upward.
The RSI was making lower highs over the previous day, even as the price pushed higher. This could be an early sign that XTZ could pull back to the $2.2-$2.25 area before pushing higher.
The A/D line, which had been in a downtrend coming into June, saw some sideways movement and managed to climb higher over the past two days. This was a sign of rising buying pressure and indicated demand behind the rally.
Conclusion
A retest of the $2.2-$2.3 area could occur after the price appeared to show a bearish divergence with the RSI on the H1 chart. However, the short-term trend remains bullish, and $2.41 and $2.59 can be used by the buyers as take profit levels.


![Rising bond yields put Bitcoin [BTC] at risk — a Fed rate hike could be next](https://ambcrypto.com/wp-content/uploads/2026/08/IMG_4752-e1785656382502.webp)