The $75 line in the sand: Hyperliquid approaches a key decision point
Hyperliquid was one of the only large-cap crypto assets that maintained a long-term bullish trend.

Since October 2025, Bitcoin [BTC] and most of the altcoins have been trending downward. Many alts, even prominent ones, never really got a long-term uptrend going. The price gains in the past couple of days for BTC and other tokens were only a bounce within a downtrend.
Hyperliquid [HYPE] was one of the large-cap tokens whose long-term trend was firmly bullish.
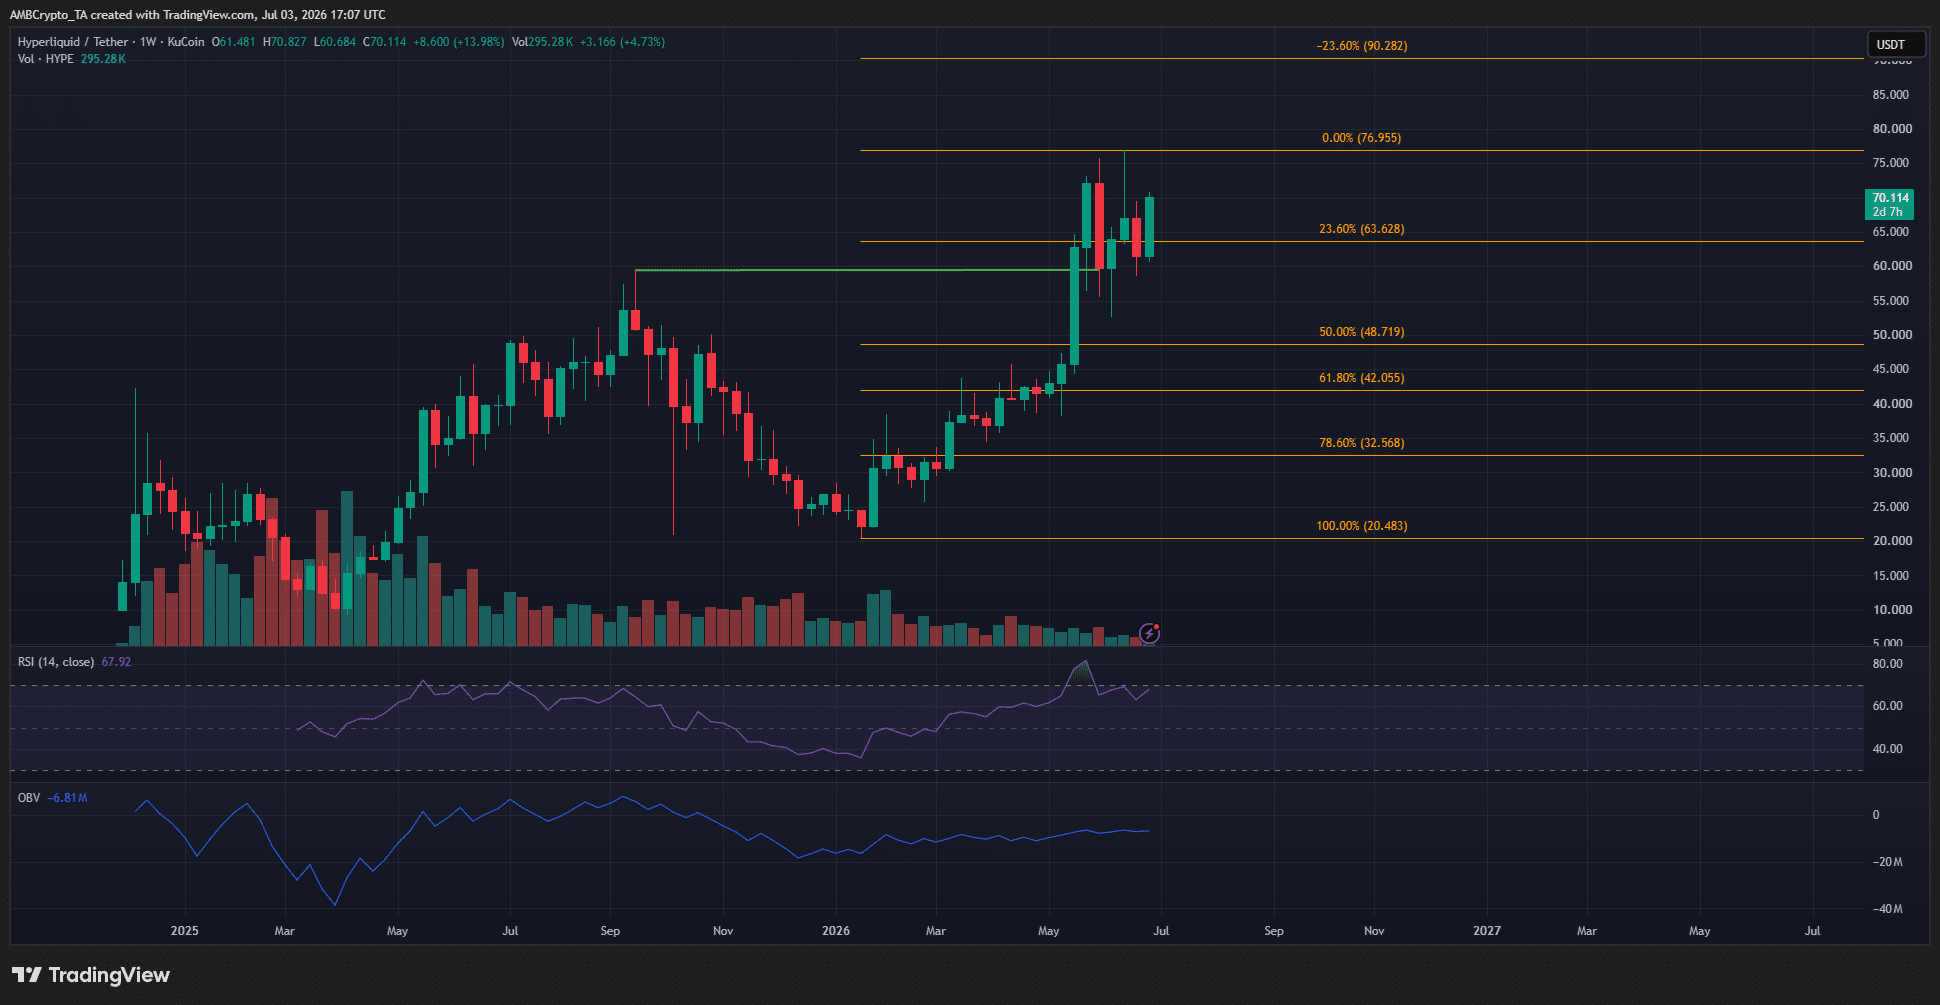
As the 1-week chart above highlights, the swing structure has been bullish for more than a year. It was trading at $70.11, and was up 7.51% in the past week and over 74% up in a year.
This cemented the long-term bullish trend, but the RSI was forming lower highs in recent weeks while HYPE bulls tried to push prices to new highs. Hence, a weekly session move beyond $72.1 would present a bearish divergence, though it doesn’t guarantee an immediate correction.
Here’s what traders and investors can expect from Hyperliquid token’s price action.
HYPE price prediction for July
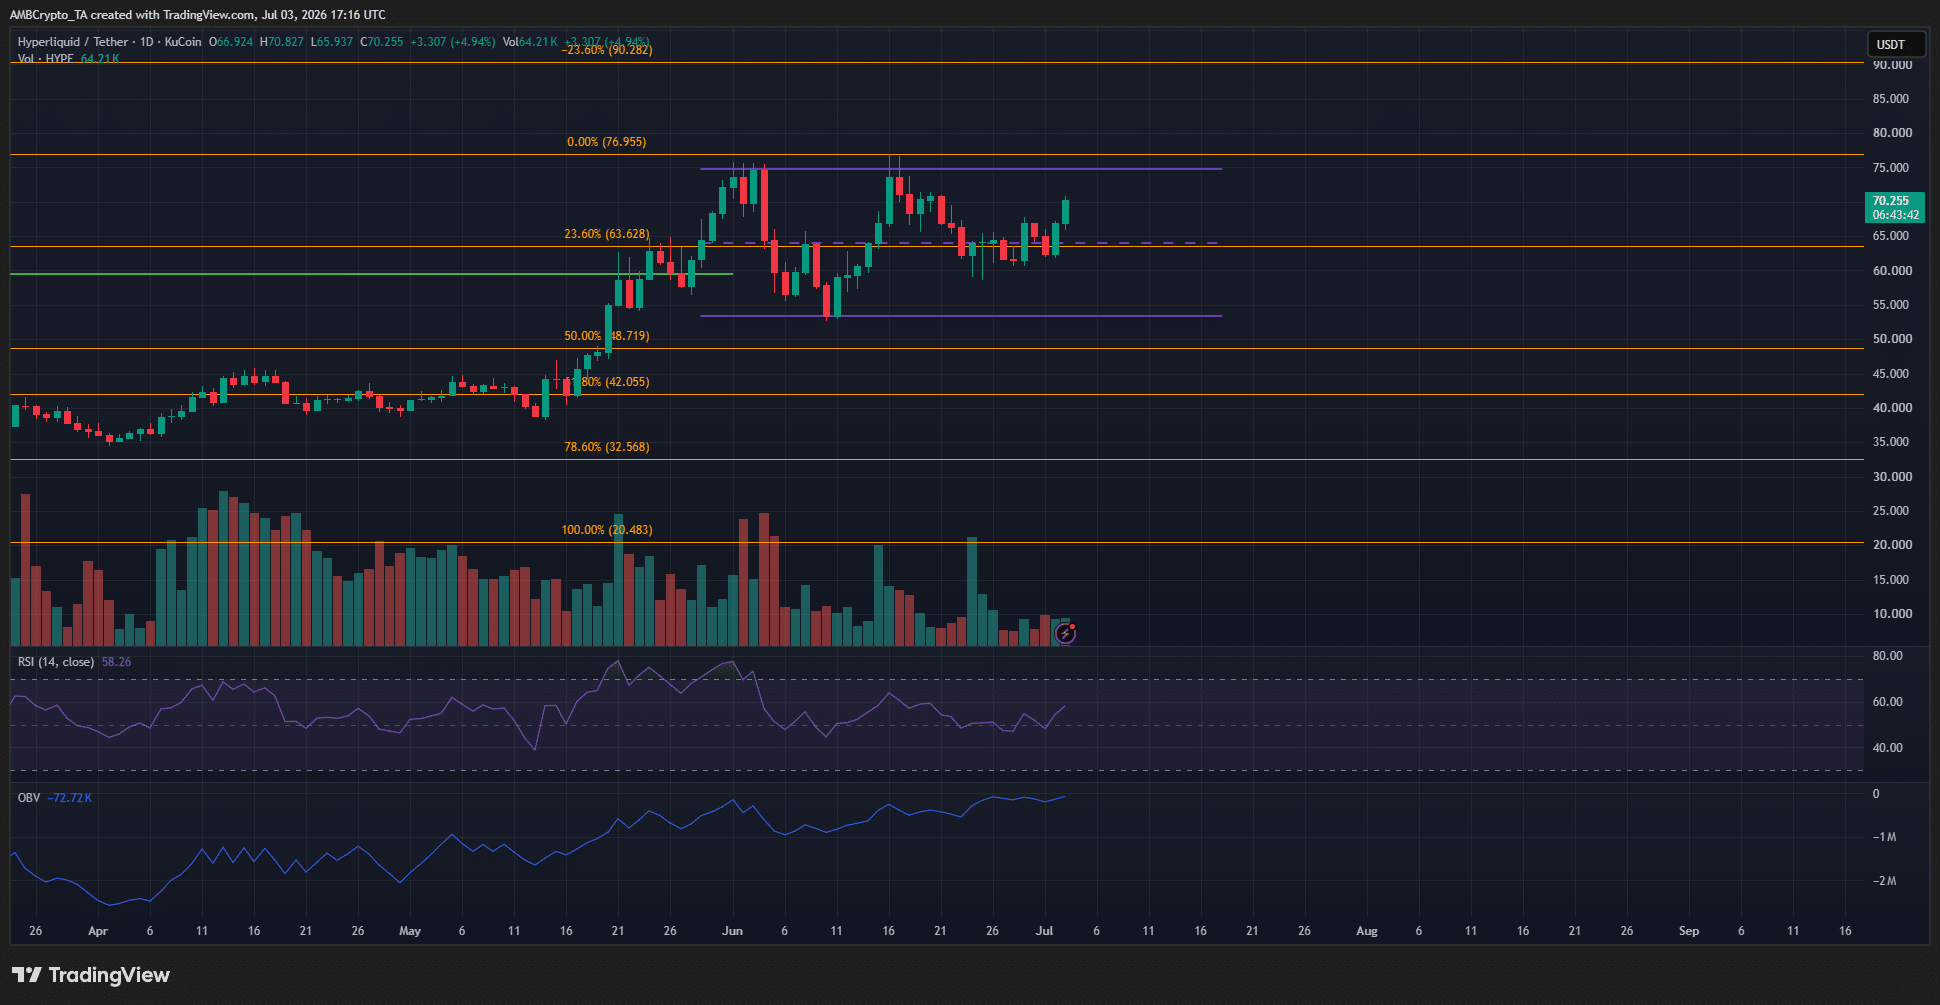
Over the past month of trading, the DEX token has formed a range [purple] between $53.35 and $74.78. At the time of writing, the price was above the mid-range resistance at $64.1 and also the short-term resistance zone at $67.2.
This upward push came despite some profit-taking by whales. The selling was being absorbed by the demand in the market.
Combined with the recent bullish momentum for Bitcoin, it appeared likely that HYPE can continue higher toward $75.
The OBV was climbing steadily, and the RSI remained above neutral 50. Together, they signaled steady buying pressure and intact bullish momentum.
Traders’ call to action- Wait
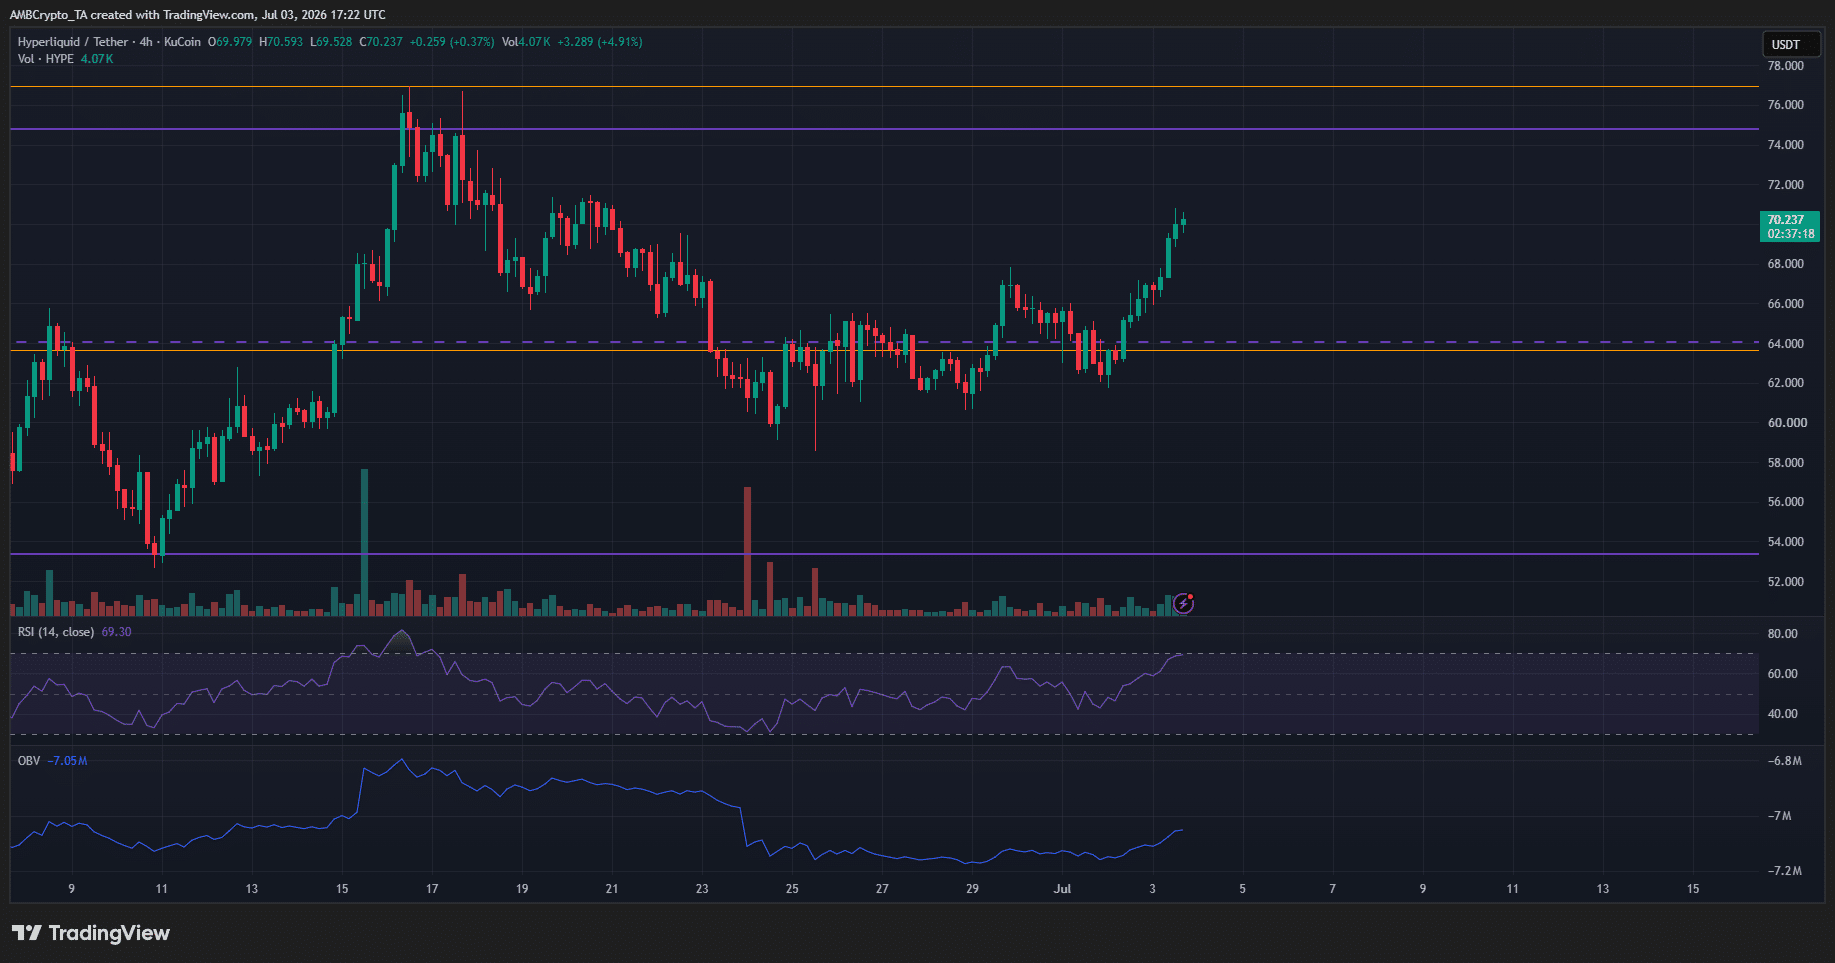
The range formation needs to be cleared for the next decisive higher timeframe move. Within this range, a test of either extreme can offer swing traders an opportunity to enter.
Right now, this opportunity was not at hand. The risk-to-reward was not ideal for swing traders at the time of writing.
The technical indicators favored short-term upside. Therefore, a move toward the $75 supply zone and a bearish reaction from there can be used to sell the token, targeting the mid-range and range-low support levels.
Final Summary
- Hyperliquid was one of the only large-cap crypto assets that maintained a long-term bullish trend.
- The $75 supply zone was vital for swing traders. A breakout past, or a rejection from, this area would be a signal for traders to place directional bets.