The A to Z of what Ethereum needs to do to maintain bullish structure

Disclaimer: The findings of the following analysis are the sole opinions of the writer and should not be taken as investment advice
A decisive close below Ethereum’s daily 20-SMA (red) put sellers back in the mix after minor gains were observed. ETH’s early-mid August channel can now be expected to come under the limelight once again as buyers find renewed momentum.
It is also important to understand that the 7 September sell-off was not even close to the one observed on 19 May. However, the same could translate into heavy losses if buyers are not careful.
At the time of writing, Ethereum was trading at $3,295, down by 2.7% over the last 24 hours.
Ethereum Daily Chart
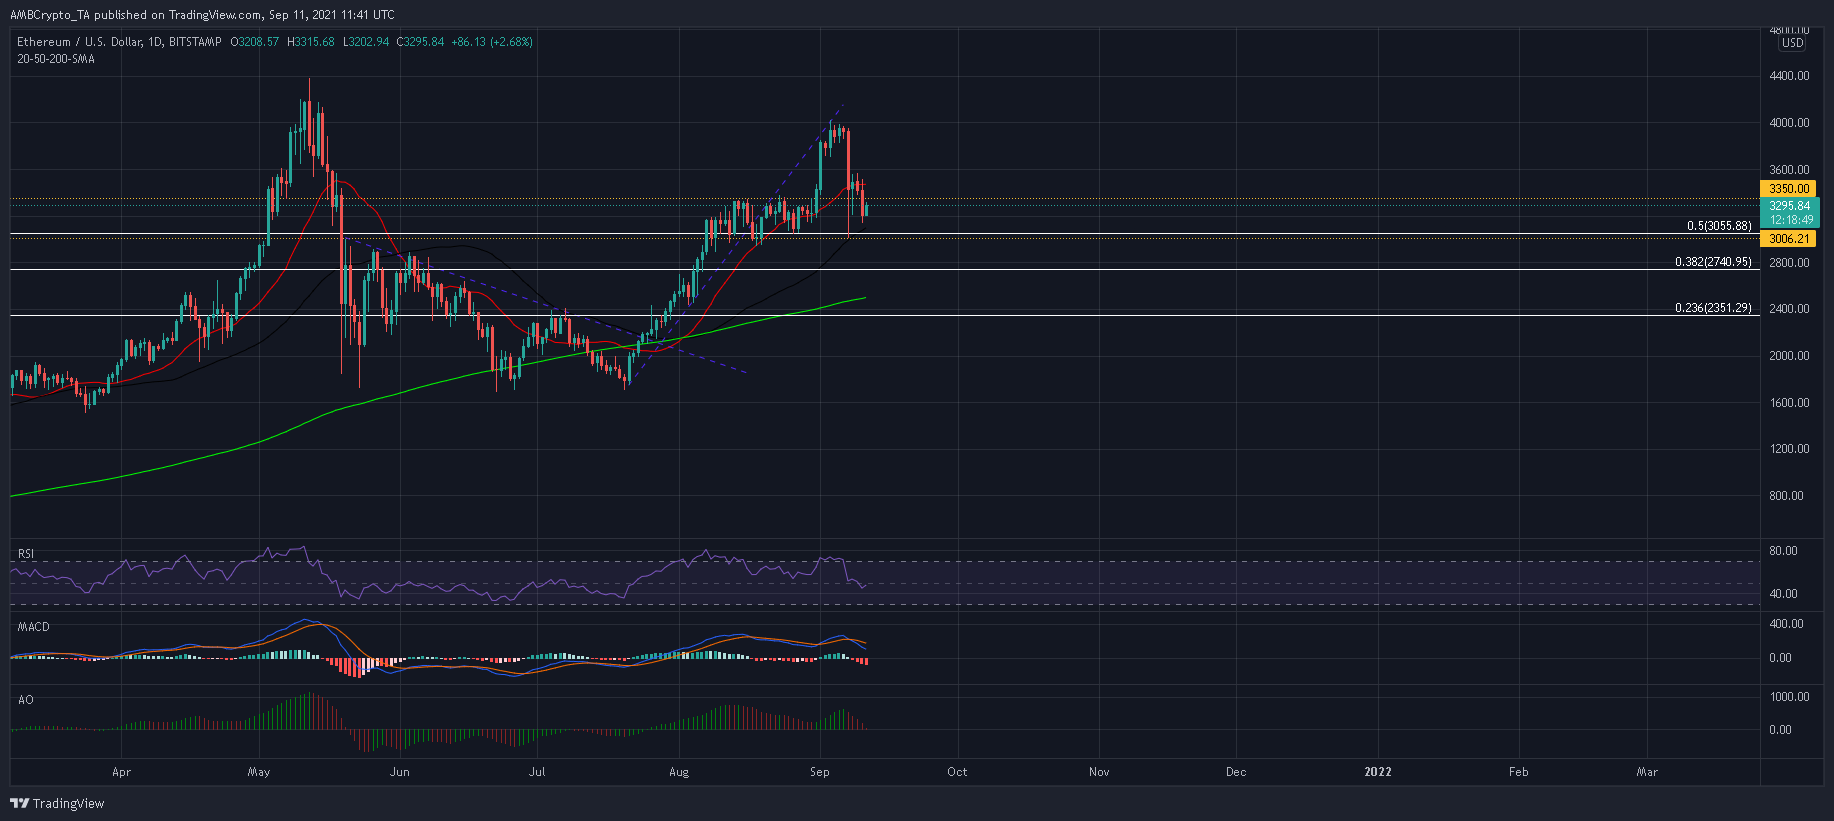
ETH can be expected to find a resting ground between $3,000-$3,550 before the next major market swing. The aforementioned channel had triggered a period of consolidation previously as ETH cooled off from a rally that extended from its July lows.
Considering the recent pullback, ETH still held a bullish shape at press time. The price was trading above its 50 (yellow) and 200 (green) Simple Moving Average lines.
However, it is important for ETH to hold a position above its 50% Fibonacci level to maintain a bullish narrative. Failing to do so would drag the price towards the 38.2% Fib mark, one from where short-sellers will carry the threat of additional drawdowns.
On the other hand, an immediate close above the 20-SMA would alleviate many uncertainties in the market, although a retest of $4,000 will be unlikely. Not until ETH’s indicators can overturn their bearish signals.
Reasoning
Most of ETH’s indicators formed bearish setups. The MACD’s fast-moving line slipped under the Signal line. This paved the way for additional losses all the way below the half-line. Meanwhile, buying strength was limited in the market as the Awesome Oscillator formed two peaks but failed to move higher.
At press time, the AO threatened to close below its mid-line – Aa development that usually triggers short selling.
Finally, the RSI seemed to disregard such bearish predictions. The index continued to trade close to equilibrium and had not conceded to downwards pressure.
Conclusion
As there seemed to be some evidence of buying pressure, ETH has the potential to stem incoming losses. As a result, the price can be expected to stabilize between $3,000 and $3,550, before a wider trend took over.
The RSI, MACD, and the Awesome Oscillator were trading above their half-lines but did carry some threat going forward. If these indicators maintain their southbound movement, a few more losses would line up for the world’s second-largest digital asset.
In order to maintain a bullish thesis, ETH would need to hold above $3,000.