
Post the market-wide retracements, The Graph, Harmony, and Chiliz clocked in over 5% losses in the last 24 hours. Market buyers now tried to cope with the sell-offs and endeavor to dress the wounds of the recent losses.
The Graph (GRT)
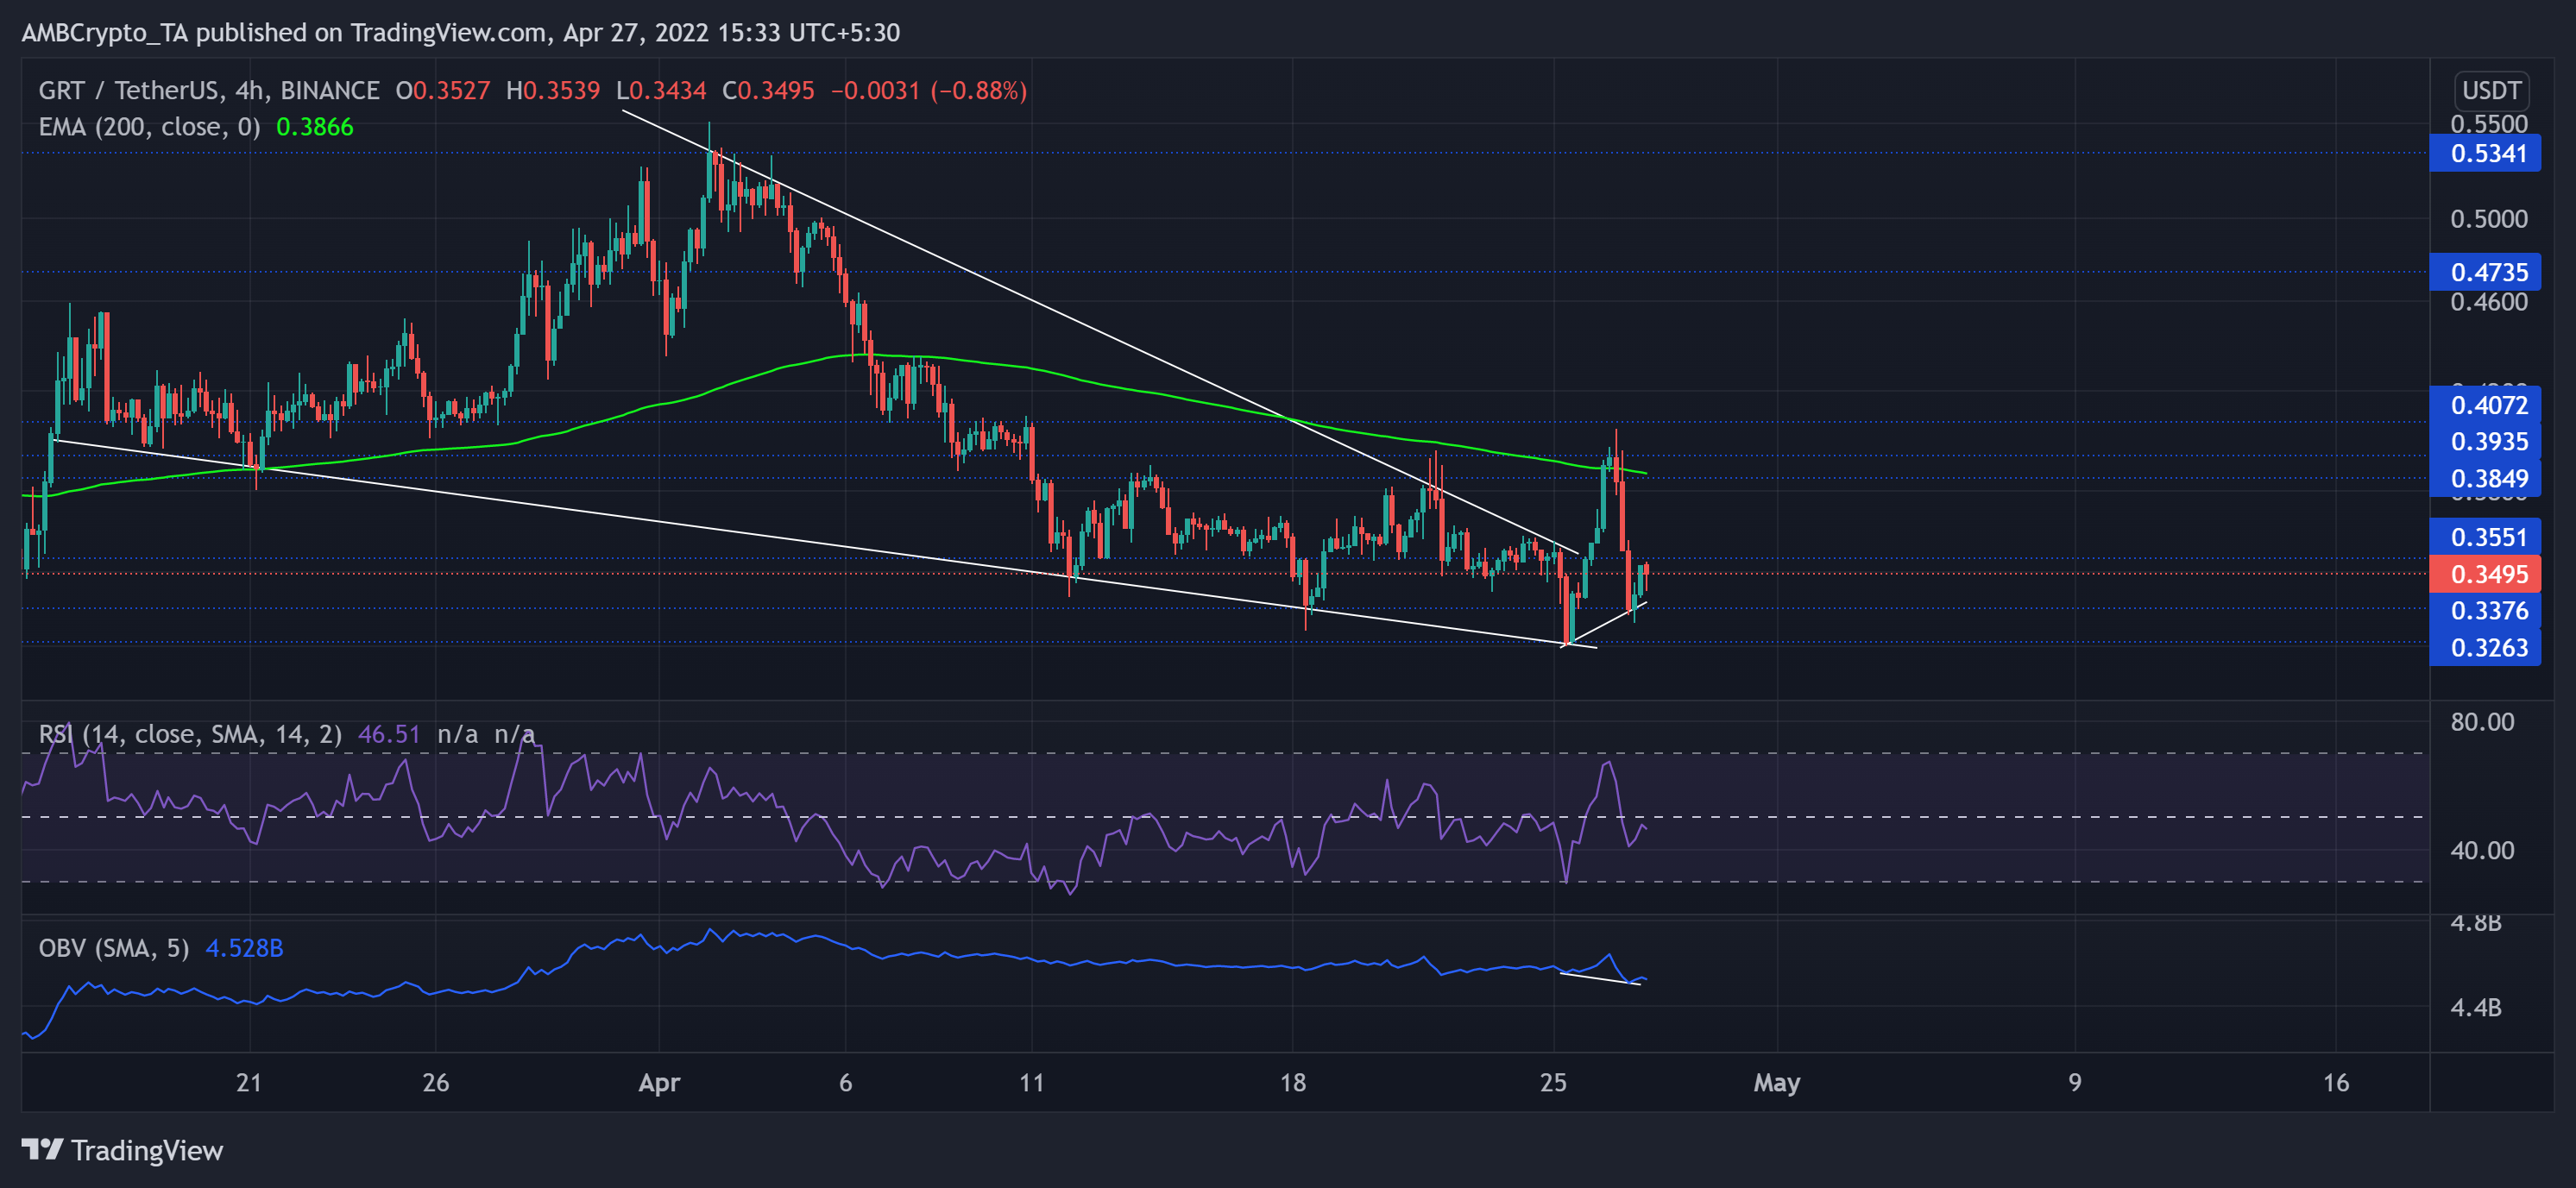
Source: TradingView, GRT/USDT
Since dropping from the $0.5 resistance, GRT has rather witnessed a bear show on its chart. The recent bloodbath plunged GRT below the $0.39 mark. This selling spree discounted the altcoin by 41.1% and carried it to the $0.32 baseline.
Meanwhile, on the 4-hour timeframe, the bulls responded by propelling a falling wedge breakout. But the 200 EMA (green) shunned the recovery as the alt flipped back into a correction phase.
At press time, GRT was trading at $0.3495, down by 10.6% in the last 24 hours. The RSI continued to portray a selling edge while struggling to conquer the 50-mark. Nevertheless, the OBV bullishly diverged from the price that helped the buyers hold the $0.33-mark.
Harmony (ONE)
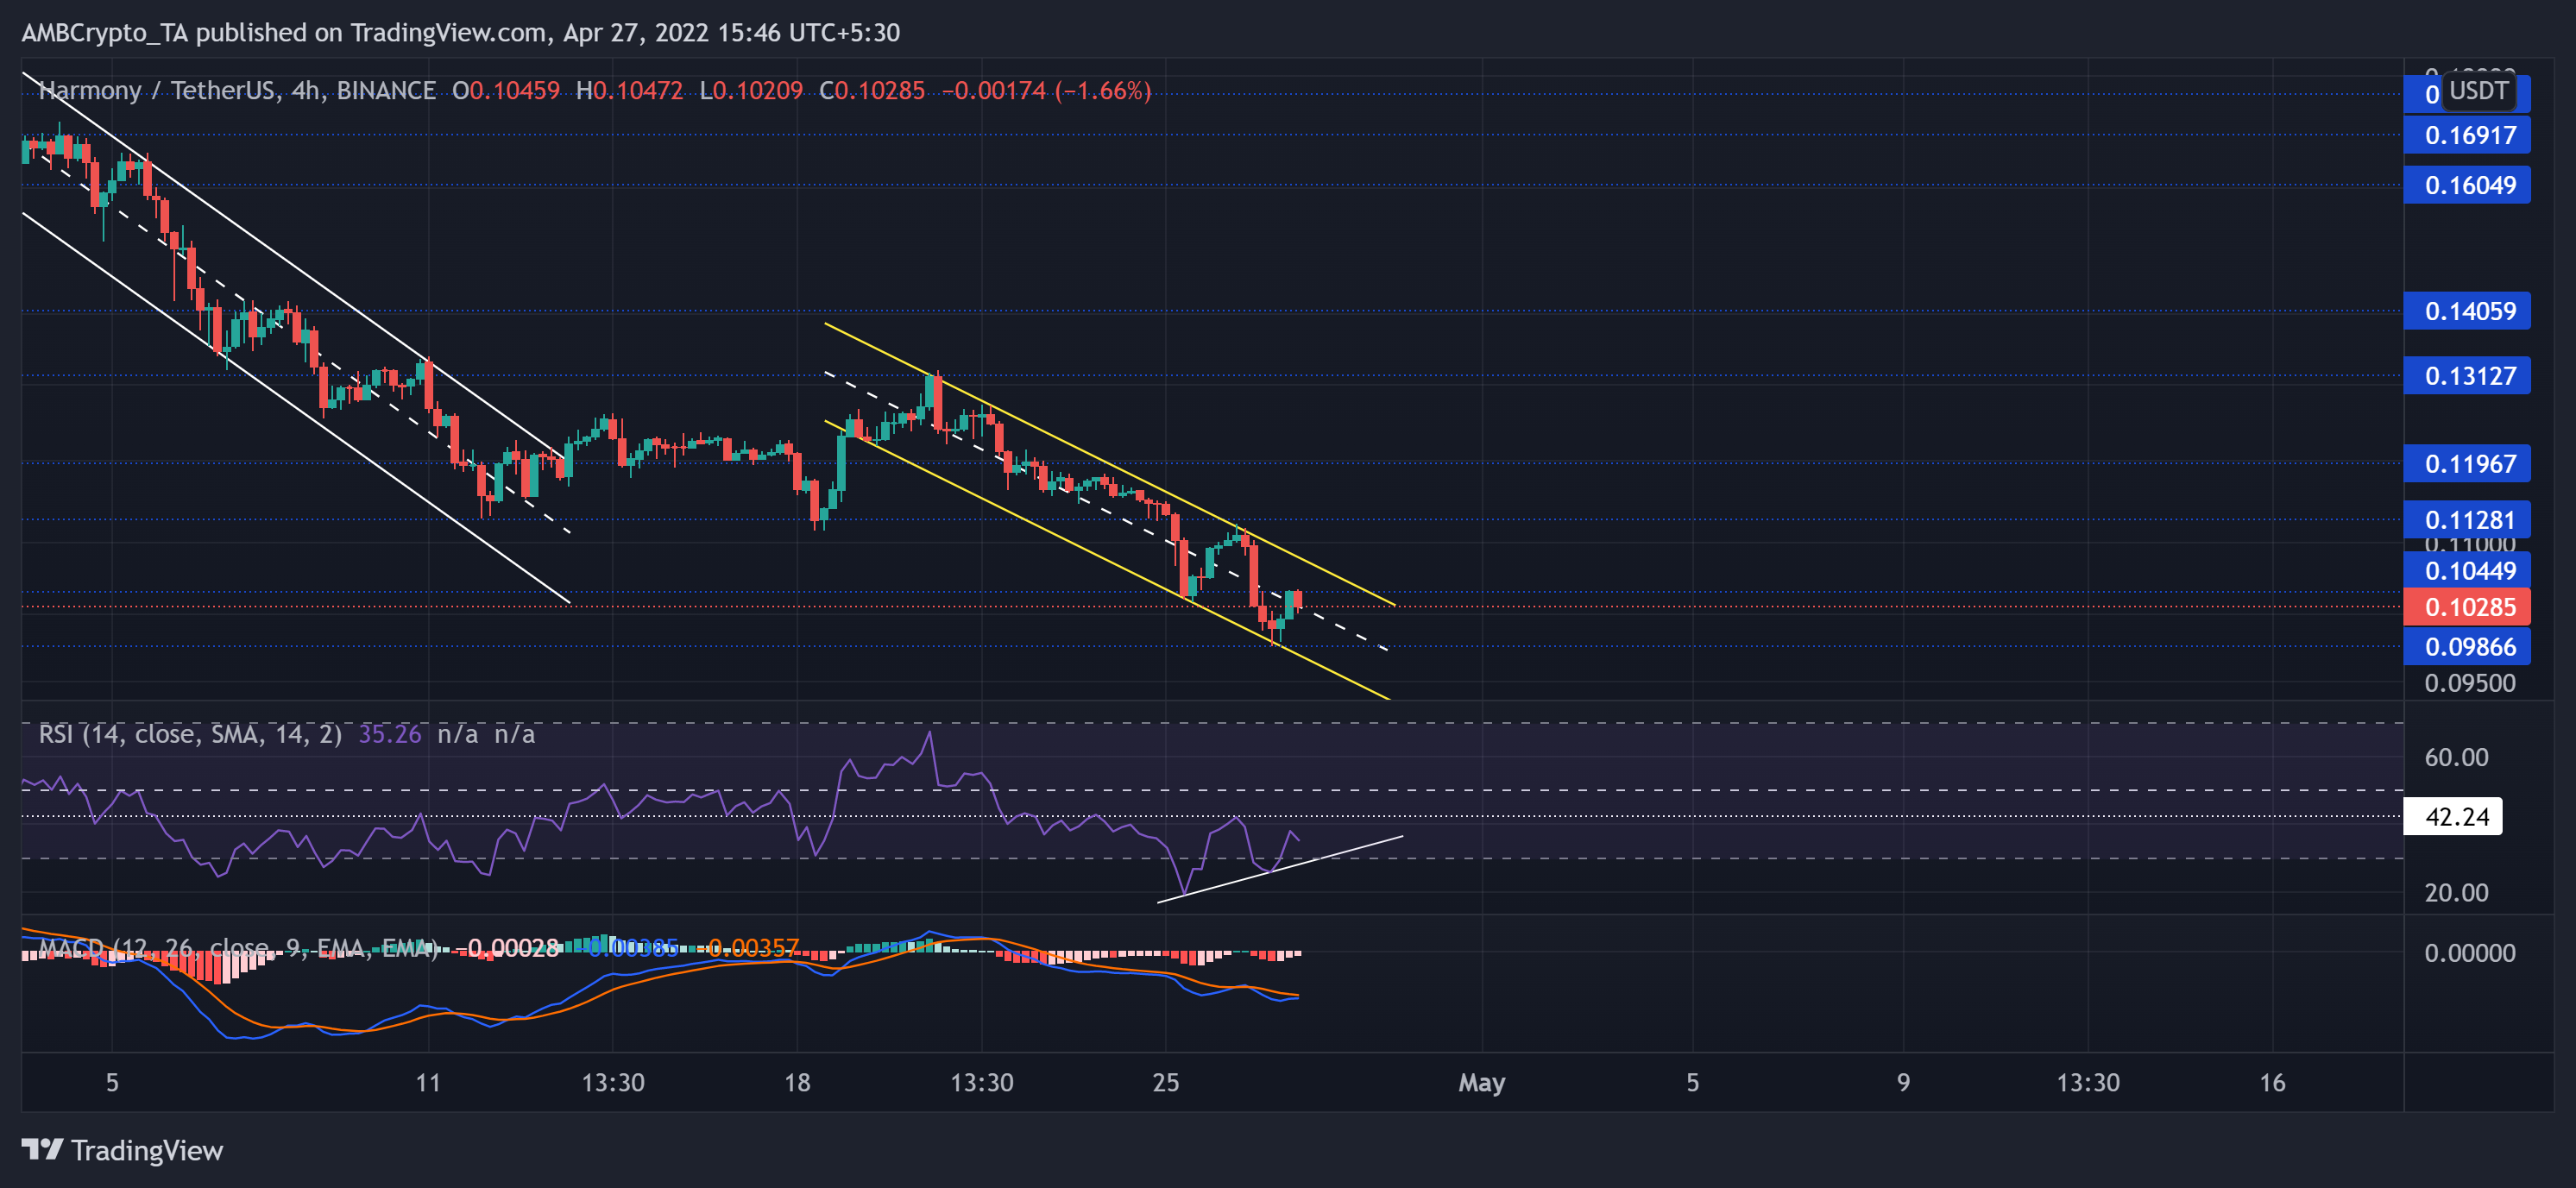
Source: TradingView, ONE/USDT
The recent sell-off phase led ONE to shed over 45% (from 31 March) of its value until it touched its 33-week low on 27 April.
Since breaking out from its previous down-channel, the bulls found it tough to sustain a rally beyond the $0.13-level. As a result, ONE lost its vital $0.1-mark support as sellers flipped it to resistance. Now, the $0.09-mark is an important area for bulls to defend to prevent further fallout.
At press time, the alt was trading at $0.10285. The RSI descended below the 42-mark resistance and affirmed a seller’s market. Its immediate support near the oversold region should support any further retracements. Additionally, MACD reaffirmed the bearish influence while its lines were yet to cross the zero-mark and undertake a bullish crossover.
Chilliz (CHZ)
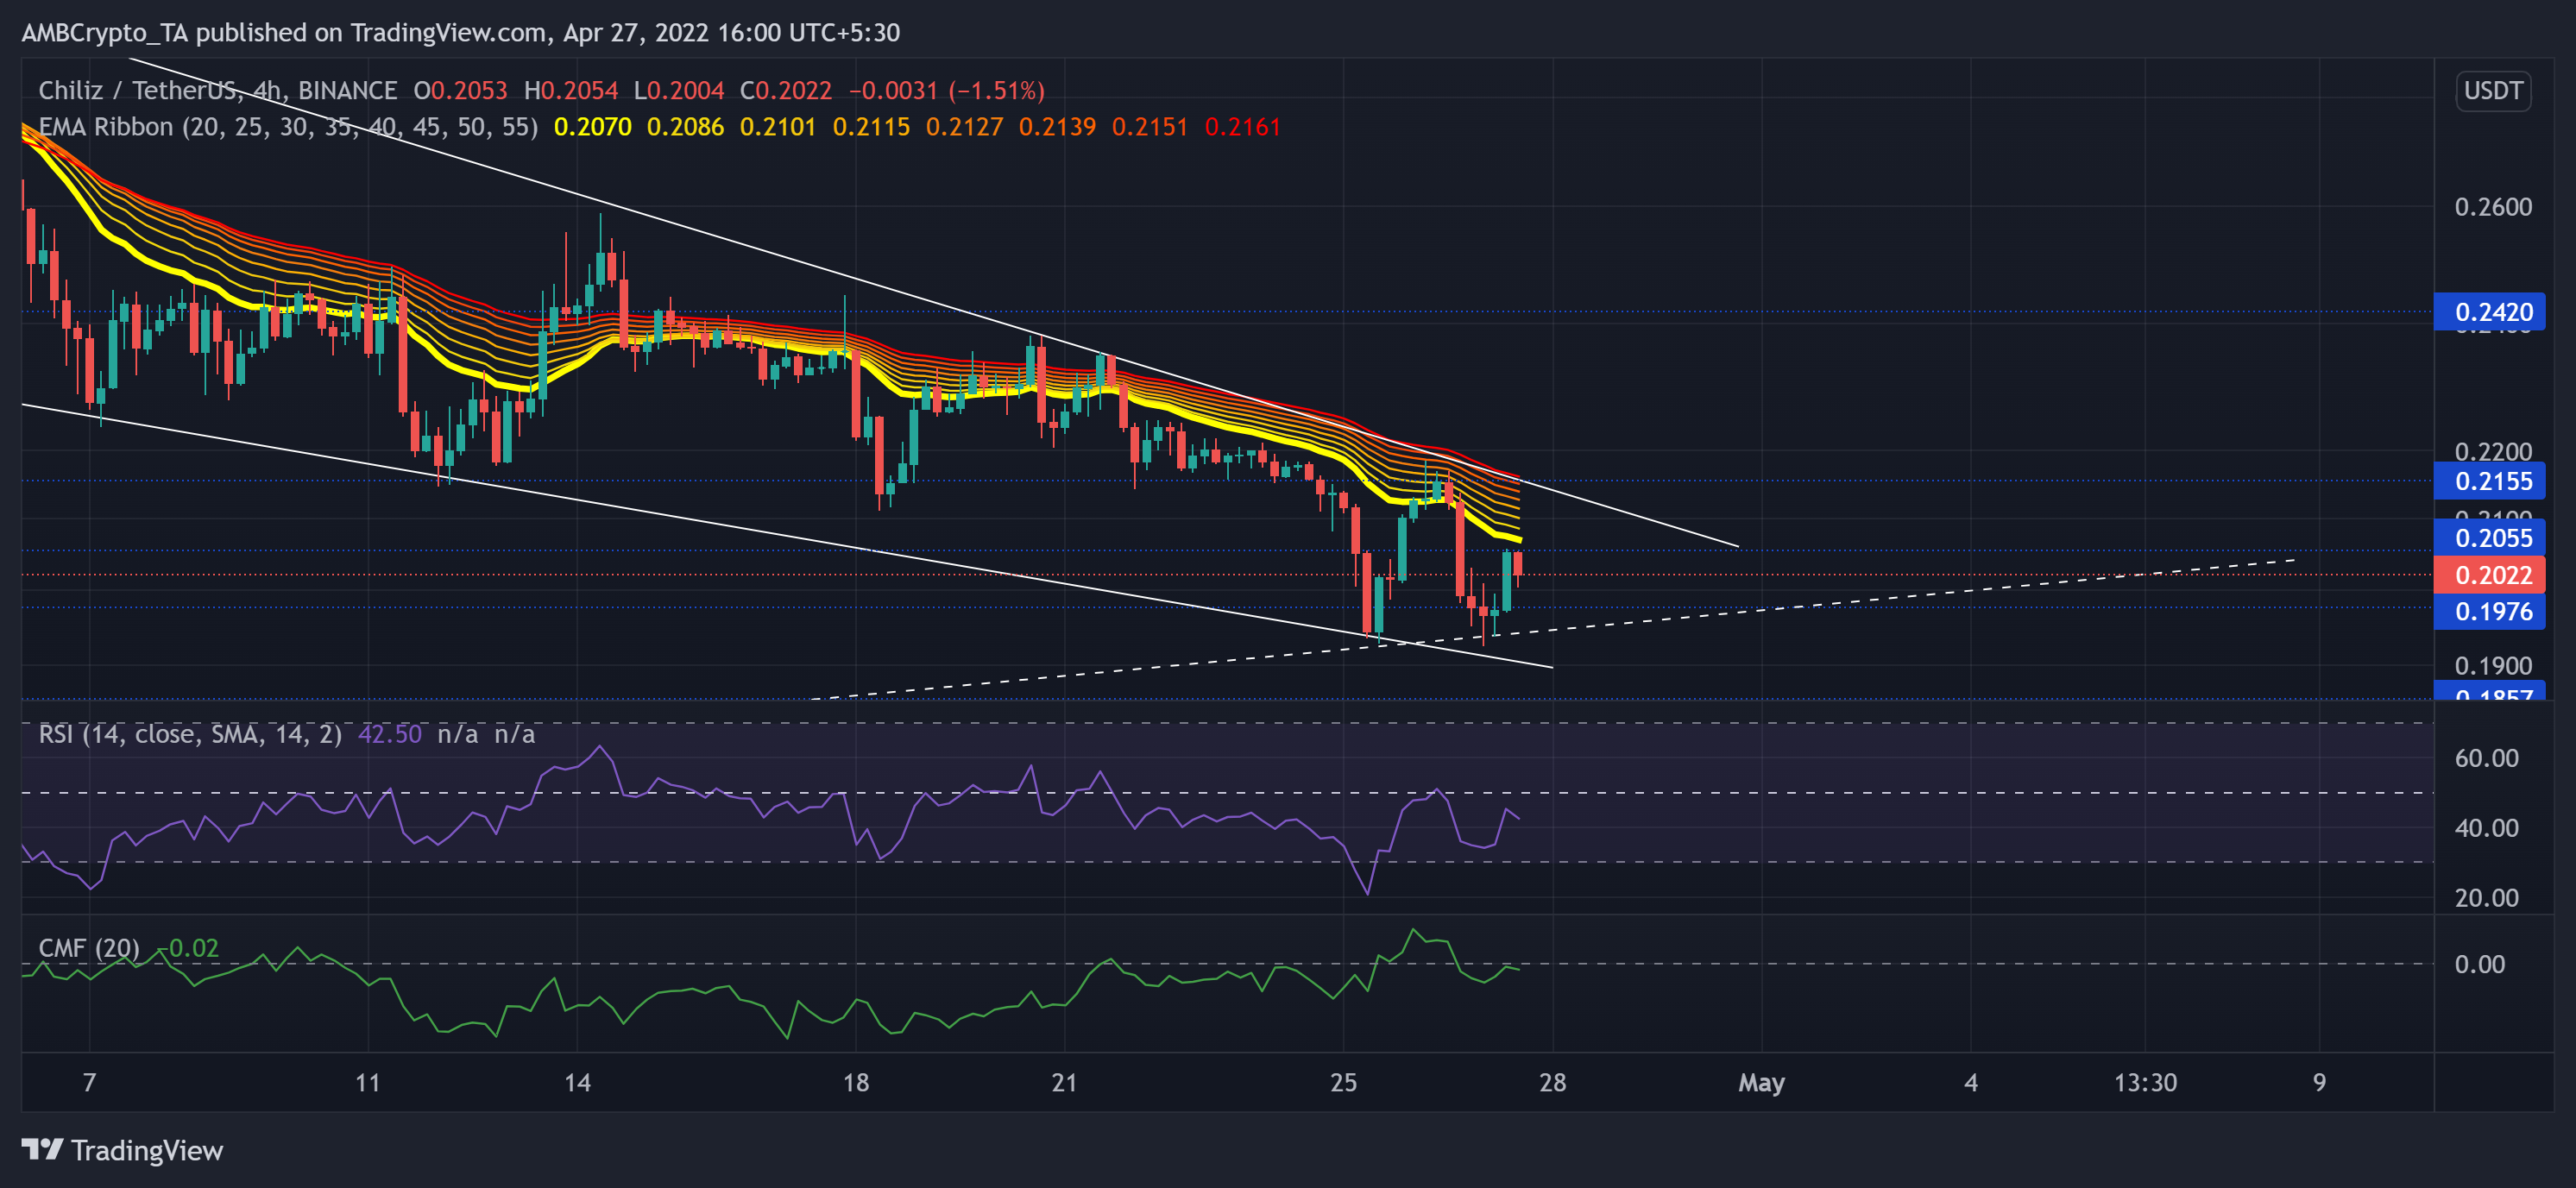
Source: TradingView, CHZ/USDT
CHZ registered a nearly 41.7% downswing after falling from its three-month high on 30 March. As a result, the price action tested the immediate trendline resistance, which the bulls held for over two months. Meanwhile, it saw a falling wedge (white, reversal pattern) on its 4-hour chart.
With the EMA ribbons constricting all the recent bull runs, the $0.2-$0.21 range would continue posing hurdles for buyers.
At press time, the alt traded at $0.2022. The RSI favored the bears while swaying below the midline for the last week. Further, the CMF needed to change its trajectory and find a spot above the zero-mark to brighten the prospects of a bull rally.