The guide to scalp Bitcoin’s ranging markets and come out successful

Bitcoin price action or any other running market often presents fractals. Identifying these templates help get an edge over the market’s moves and allows traders to scalp profitably. This article takes a quick look at what the current template is for Bitcoin’s ranging market.
Bitcoin price and the short-term bearish outlook
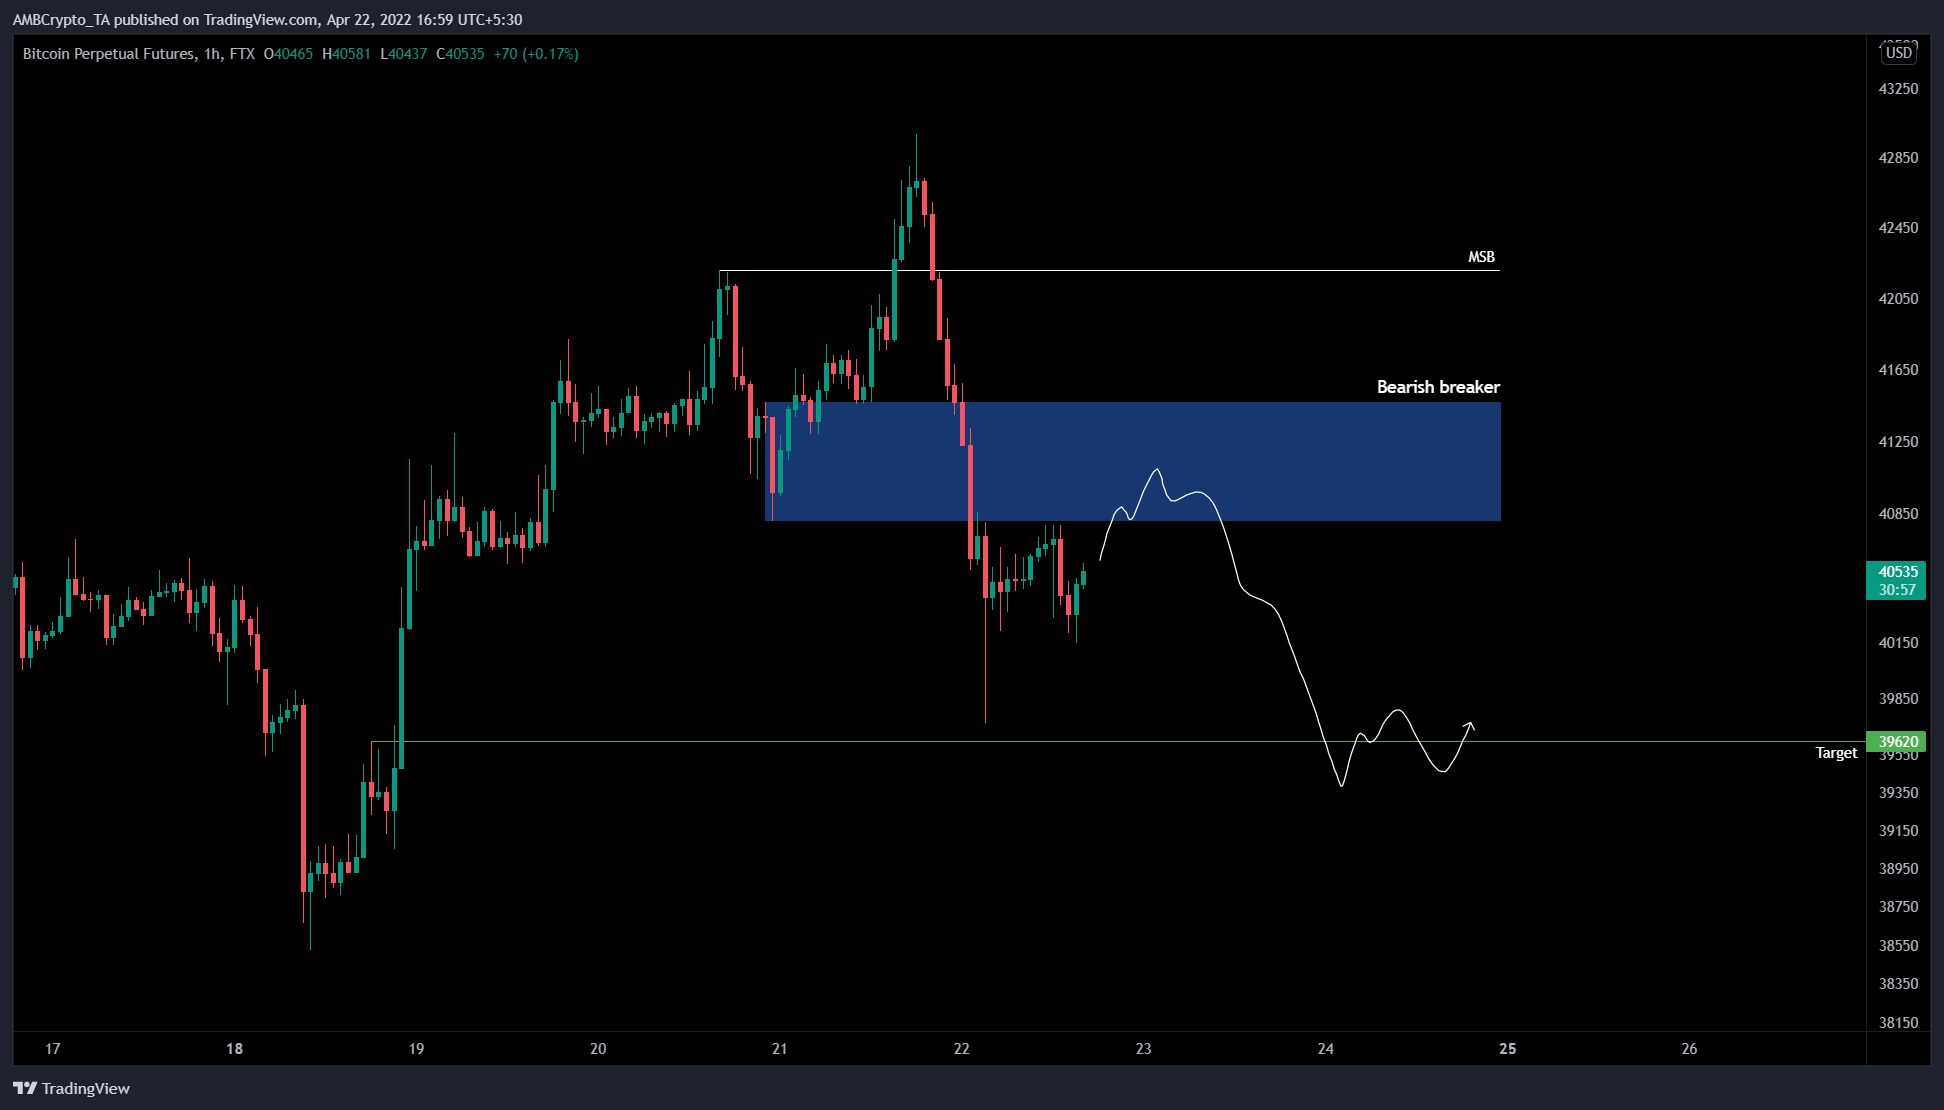
Bitcoin price on the one-hour chart set a swing high at $42,208 and broke this structure only to set a higher high at $42,988. Between these two higher highs, BTC formed a demand zone, extending from $40,808 to $41,465.
After this market structure break or MSB, Bitcoin price crashed suddenly and flipped the said demand zone into a bearish breaker. This technical formation stipulates that a retest of the breaker after a down move is often rejected due to the sell orders of the trapped investors that tried to position themselves long after a higher high.
Hence, a short-term play would be to enter a short position at $40,808 with a stop loss above $41,465. The take-profit level for this setup would be 2.90% lower – $39,620. This move would provide a 1.85R trade.
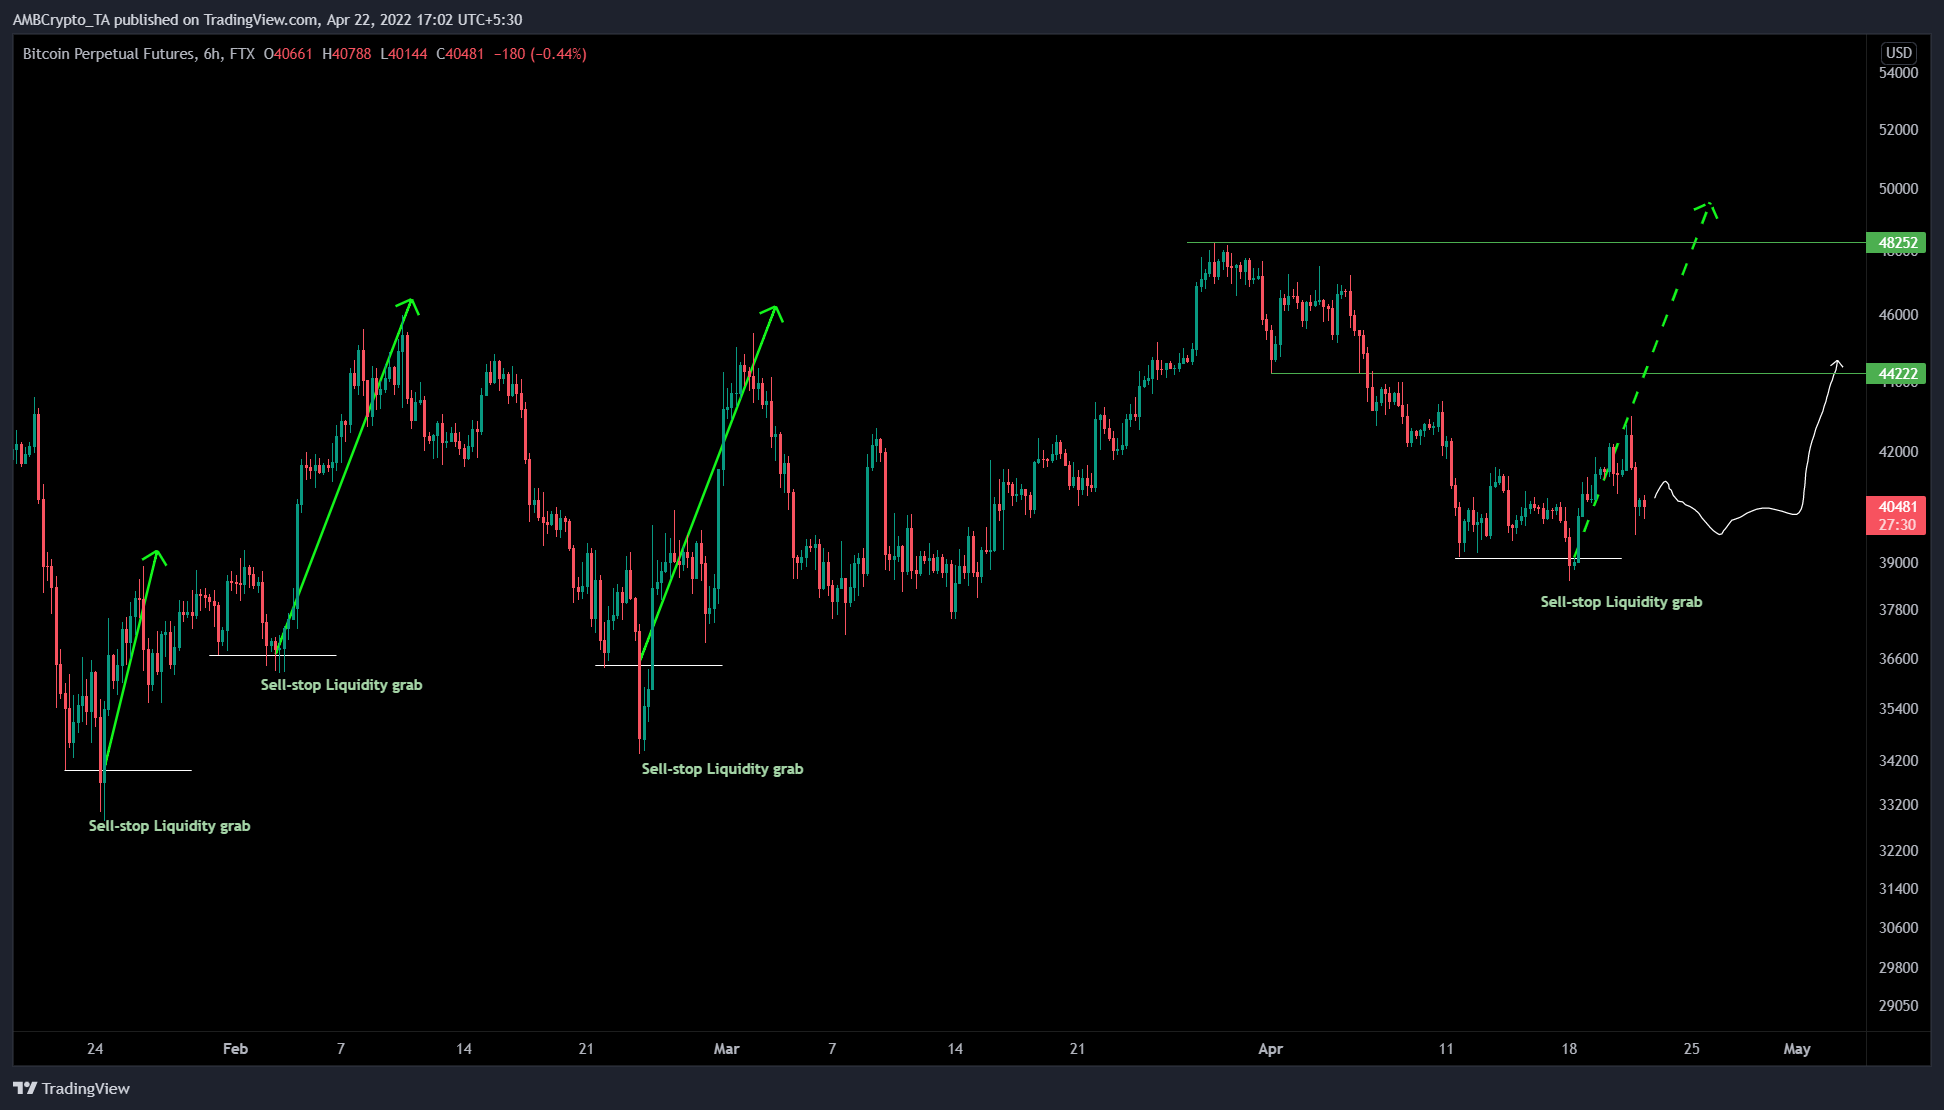
While the short-term outlook might reveal an extremely small bearish outlook, the six-hour chart shows a bullish scenario. The trend for Bitcoin price since 22 January has been a sell-side liquidity grab below a previously formed low to wipe out knife-catchers and early longers. This liquidity purge is followed by a massive, impulsive run-up that sweeps above a previously formed swing high.
A similar setup was observed on 3 and 24 February and most recently on 18 April. Therefore, investors can expect BTC to stabilize and trigger a massive, impulsive run-up to the previously formed high at $48,252.
However, there could be a brief pitstop at $44,222 before reaching the aforementioned target. This move would constitute a 19% ascent.
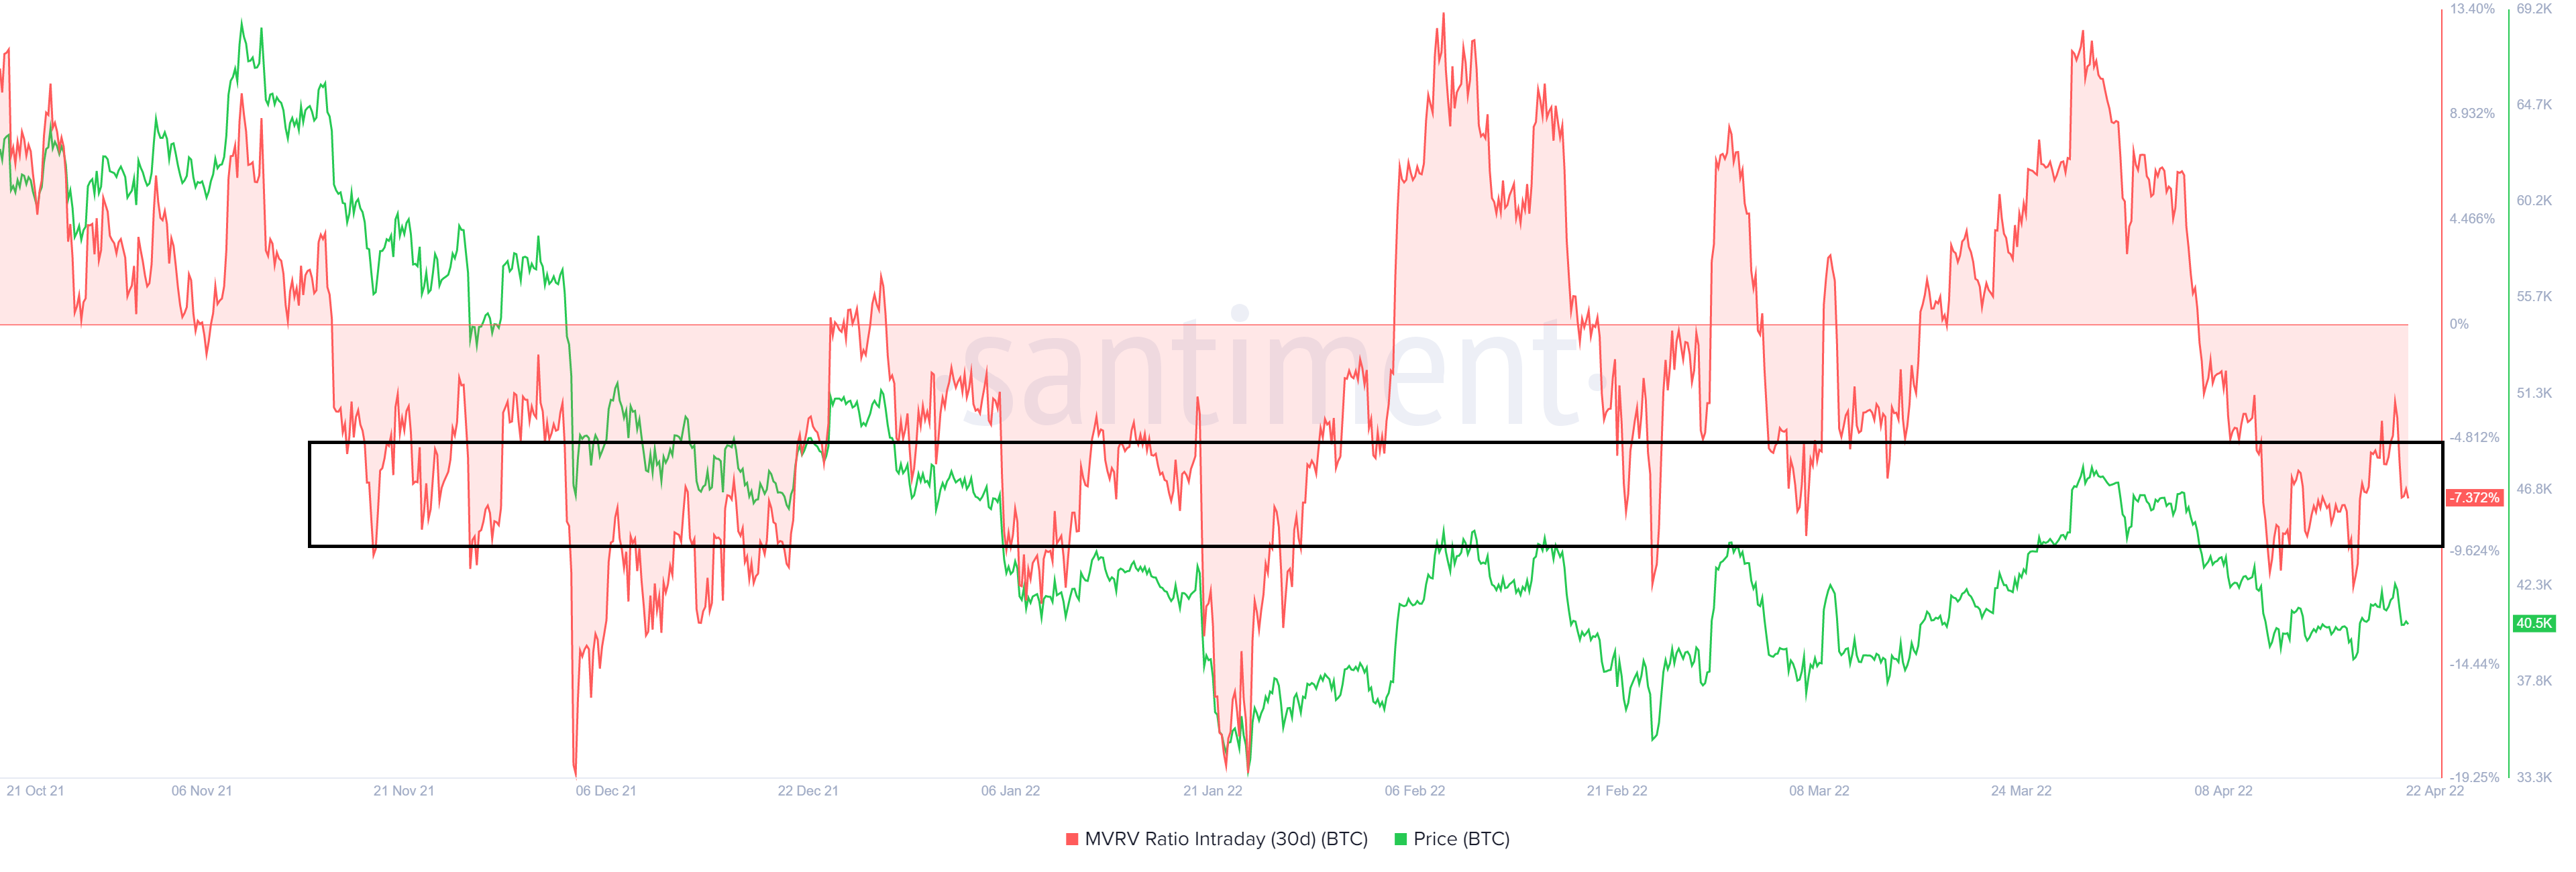
While the six-hour chart reveals a good opportunity to position yourself, the 30-day Market Value to Realized Value (MVRV) model further supports this trend reversal. The index is used to assess the average profit/loss of investors who purchased BTC tokens over the past month.
Santiment’s research has shown that a local bottom is often formed around -10% and indicates that short-term holders are at a loss. Interestingly enough this level is where long-term holders accumulate. Therefore, a value below -10% is often referred to as an “opportunity zone,” since the risk of a sell-off is less
As seen in the chart below, the 30-day MVRV for BTC is inside the local bottom zone that extends from -5% to -10%. Over the last three months, this area has been a hotspot where a trend reversal has taken place. Therefore, the recent flash crash is a buy zone for patient holders and matches perfectly with the outlook obtained from a technical perspective.