The positive side of BNB’s price movement, is the opportunity to buy the dip

Most altcoins, on the back of the king coin’s impressive rally, had a decent run during the initial few days of the month. However, the recent flash crash altered the gains, sending the market into a frenzy. Yet, there were some coins that showed signs of weakening, even before the market was actually struck by the crash. Binance Coin was one such alt.
Binance Coin (BNB) saw major resistance at the $500 mark for a fortnight, before falling along with the larger market on September 7. Even though the altcoin did recover lost ground on the back of an ascending triangle breakout, its price was immediately rejected at the resistance barrier. Noticeably, BNB saw a more market-dependent growth and has been struggling to catch up now. However, what’s more to its trajectory than mere losses and gains?
High social anticipation, low valuation
Notably, at the time of writing, BNB’s social volumes were spiking, and the coin was a “project in trend” on social media. This happened alongside decent price gains for the alt, as its price saw more than 5% rise in just 16 hours. But the question remained if these gains would hold or fade away after facing resistance?
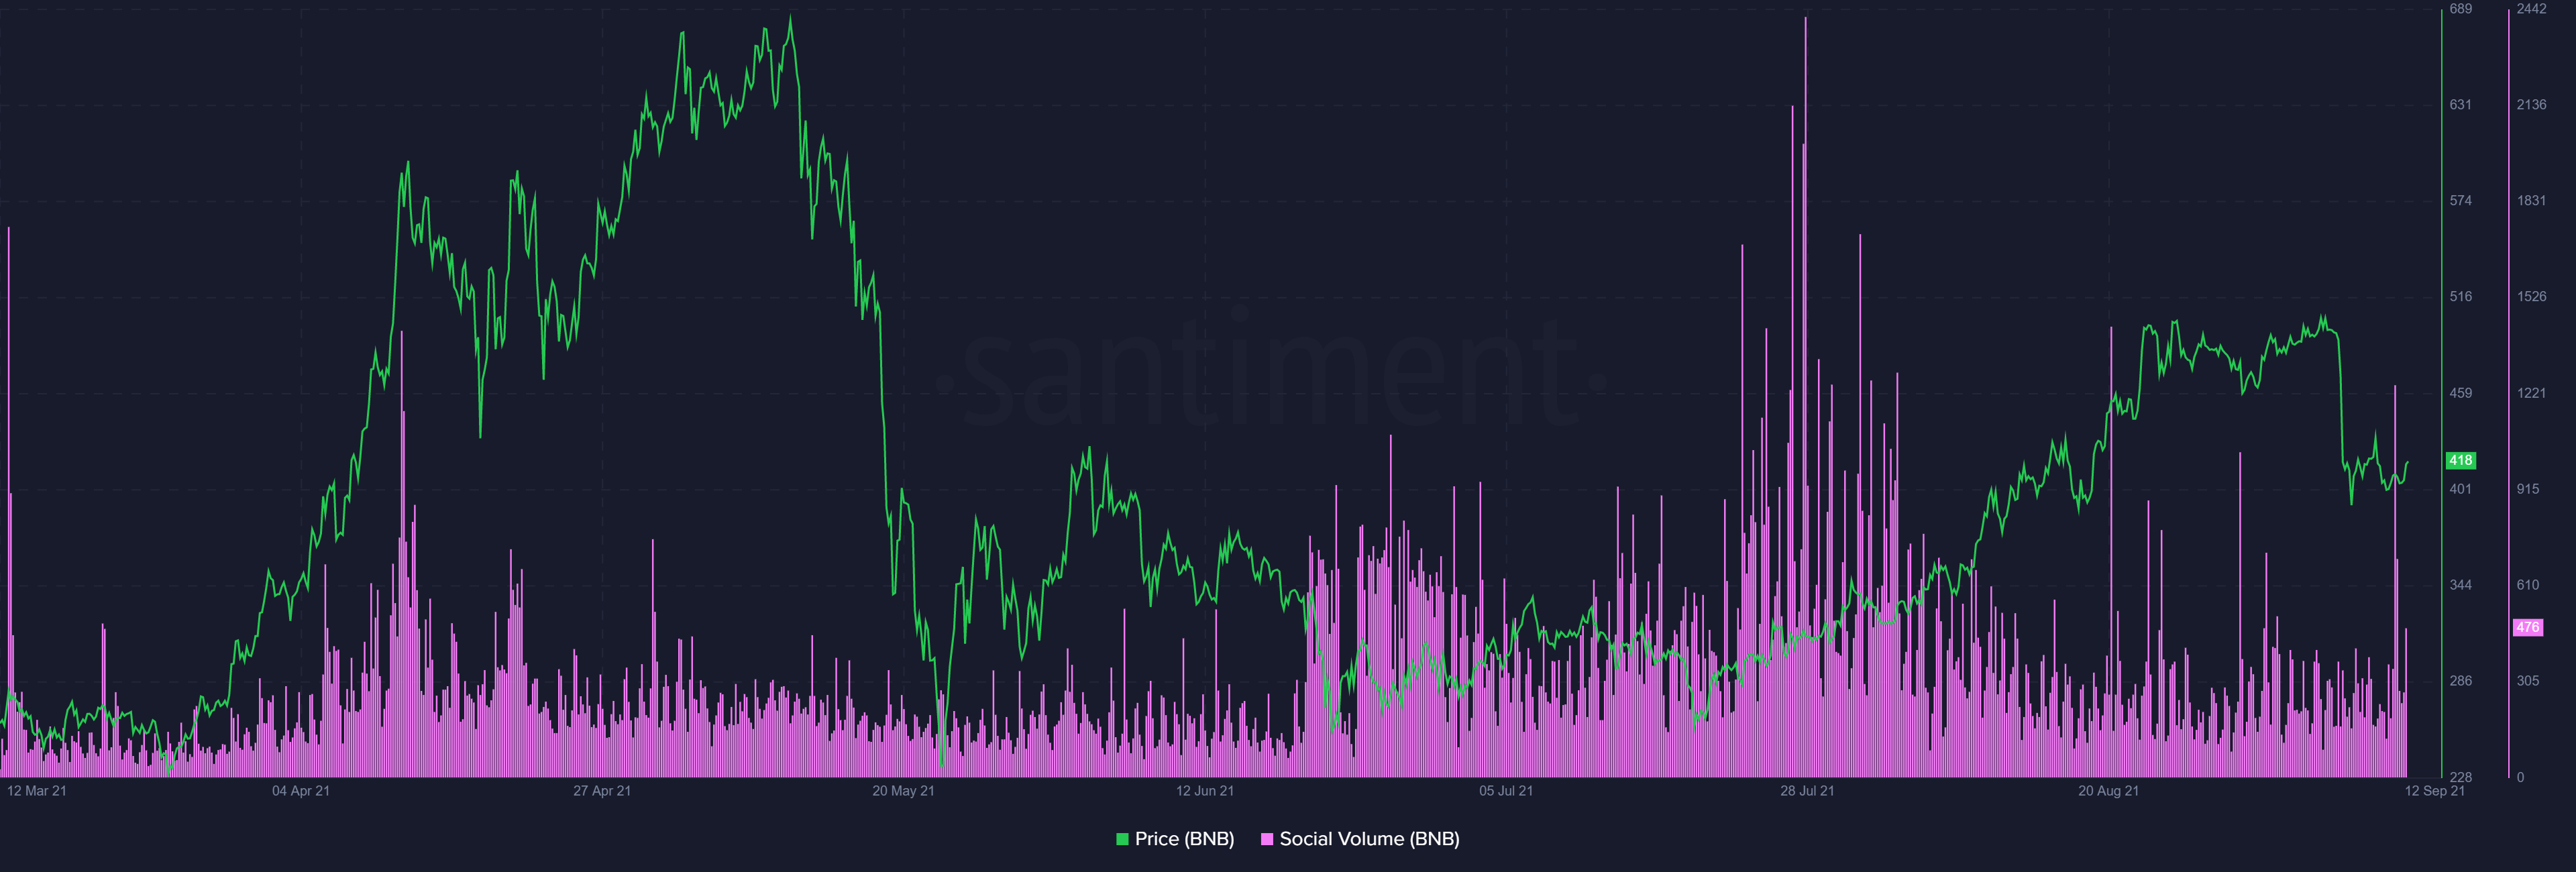
Even though BNB’s social metrics and price action looked more bullish than it was over the last week, its MVRV was treading in the negative territory. MVRV 30 day noted -7.6 which was the lowest since July 20. At that time BNB’s price was 35% lower than the current levels. Even the NFT fever couldn’t do much for the alt’s price. On September 9, the BNBPunks team introduced the latest BNB NFT marketplace, and its hype faded with diminishing prices.
Futures not looking too bright
Looking at BNB’s diminishing Open interest, its futures market didn’t give a bullish outlook. A more than 40% drop in Open interest was seen soon after the flash crash. Further, its Top Trader Long/Short Ratio (Positions) highlighted that shorts were dominating the market which meant that in the near term, the market expected a drop. The long-short ratio (positions) represents the proportion of net long and net short positions to total open positions of the top 20% users with the highest margin balance.
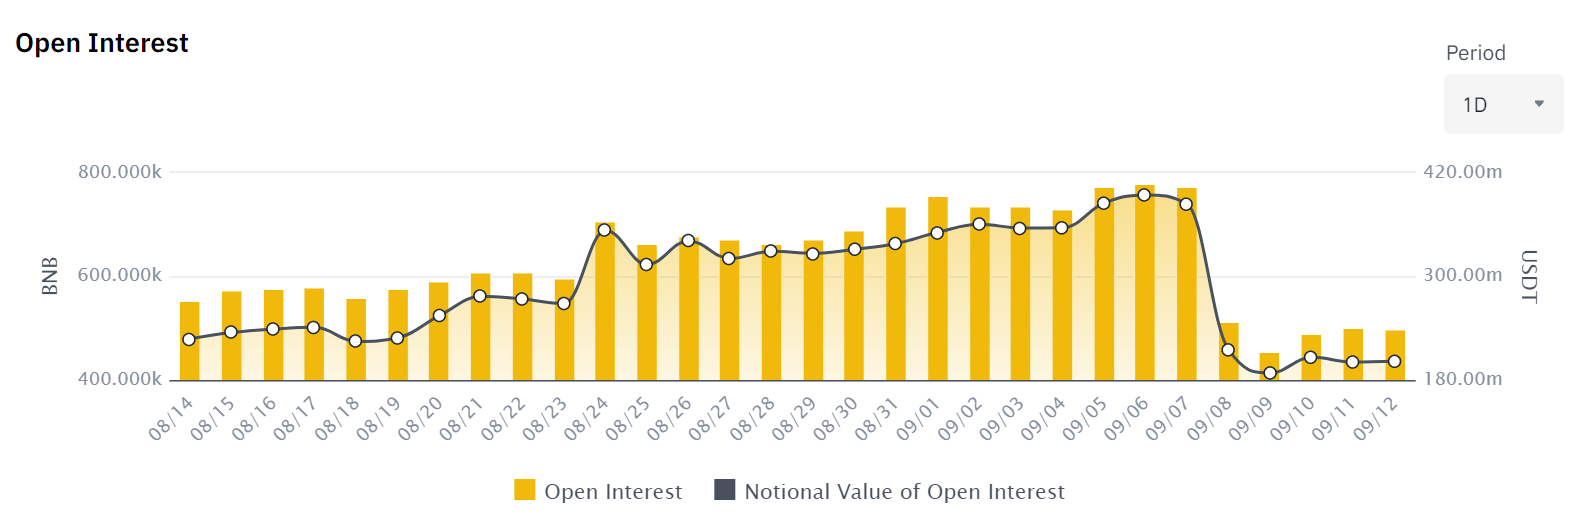
However, on the bright side, at the time of writing, on the long-short ratio, longs had started to dominate again with 82% long and 12% short positions. Additionally, BNB’s stock to flow for BNB saw a massive peak. The S2F model essentially quantifies scarcity by considering parameters like the total supply and annual production.
A higher value meant that less recent supply was entering the market and translated into more scarcity and lower inflation. Thus, all in all, this could be an opportunity to buy the dip, because even if BNB climbs up towards its last week’s peak of $504, it would mean 20% gains would be in store.


