The Sandbox, Ethereum Classic, Fantom Price Analysis: 23 February

With a 3-4% 24-hour surge in the crypto market, The Sandbox, Ethereum classic and Fantom displayed strong revival from their immediate supports. Now, as any close above their resistance points would open up gates for further recovery. Also, the recent bullish move entailed low volumes, hinting at a weak bull move.
The Sandbox (SAND)

SAND oscillated between $2.8-$4.8-zone for the last seven weeks. The previous uptrend saw staggering gains until the alt poked the $4.8-resistance.
Since then, it tested its three-week trendline support (yellow) and finally breached it on 13 February. It flipped the $3.19-level from support to immediate resistance.
The descent halted at the vital $2.8-level as the bulls stepped in to test its immediate resistance. However, SAND saw a strong rejection of higher prices at the 20 EMA (cyan) that coincided with the $3.19-level. Also, its recent candlesticks have marked a bearish pin bar, revealing a bearish edge.
At press time, SAND traded at $3.157. RSI‘s recent revival snapped its trendline resistance and eyed to challenge the 45-mark. Nevertheless, with the gap between DMI lines decreasing, the bullish revival hopes in the near term were alive.
Ethereum Classic (ETC)

Since its nine-month low on 22 January, ETC registered an exceptional 76.2% ROI and poked above the $36-resistance. Post which, it saw a 34.7% retracement and tested the $24-support.
Over the past day, ETC saw an over 9% recovery as it endeavored to test the $27-resistance. Any close below this level would confirm the existence of a hidden bearish divergence (yellow trendline).
At press time, ETC traded at $27.01. Over the past 24-hours, the RSI reversed from the oversold region and snapped off the 42-level. Any close above the trendline resistance would invalidate the likely bearish tendencies. Interestingly, the MACD histogram rose above its equilibrium and depicted decreasing selling influence. But its lines were still below the zero-line, hinting that the buyers were still not in control.
Fantom (FTM)
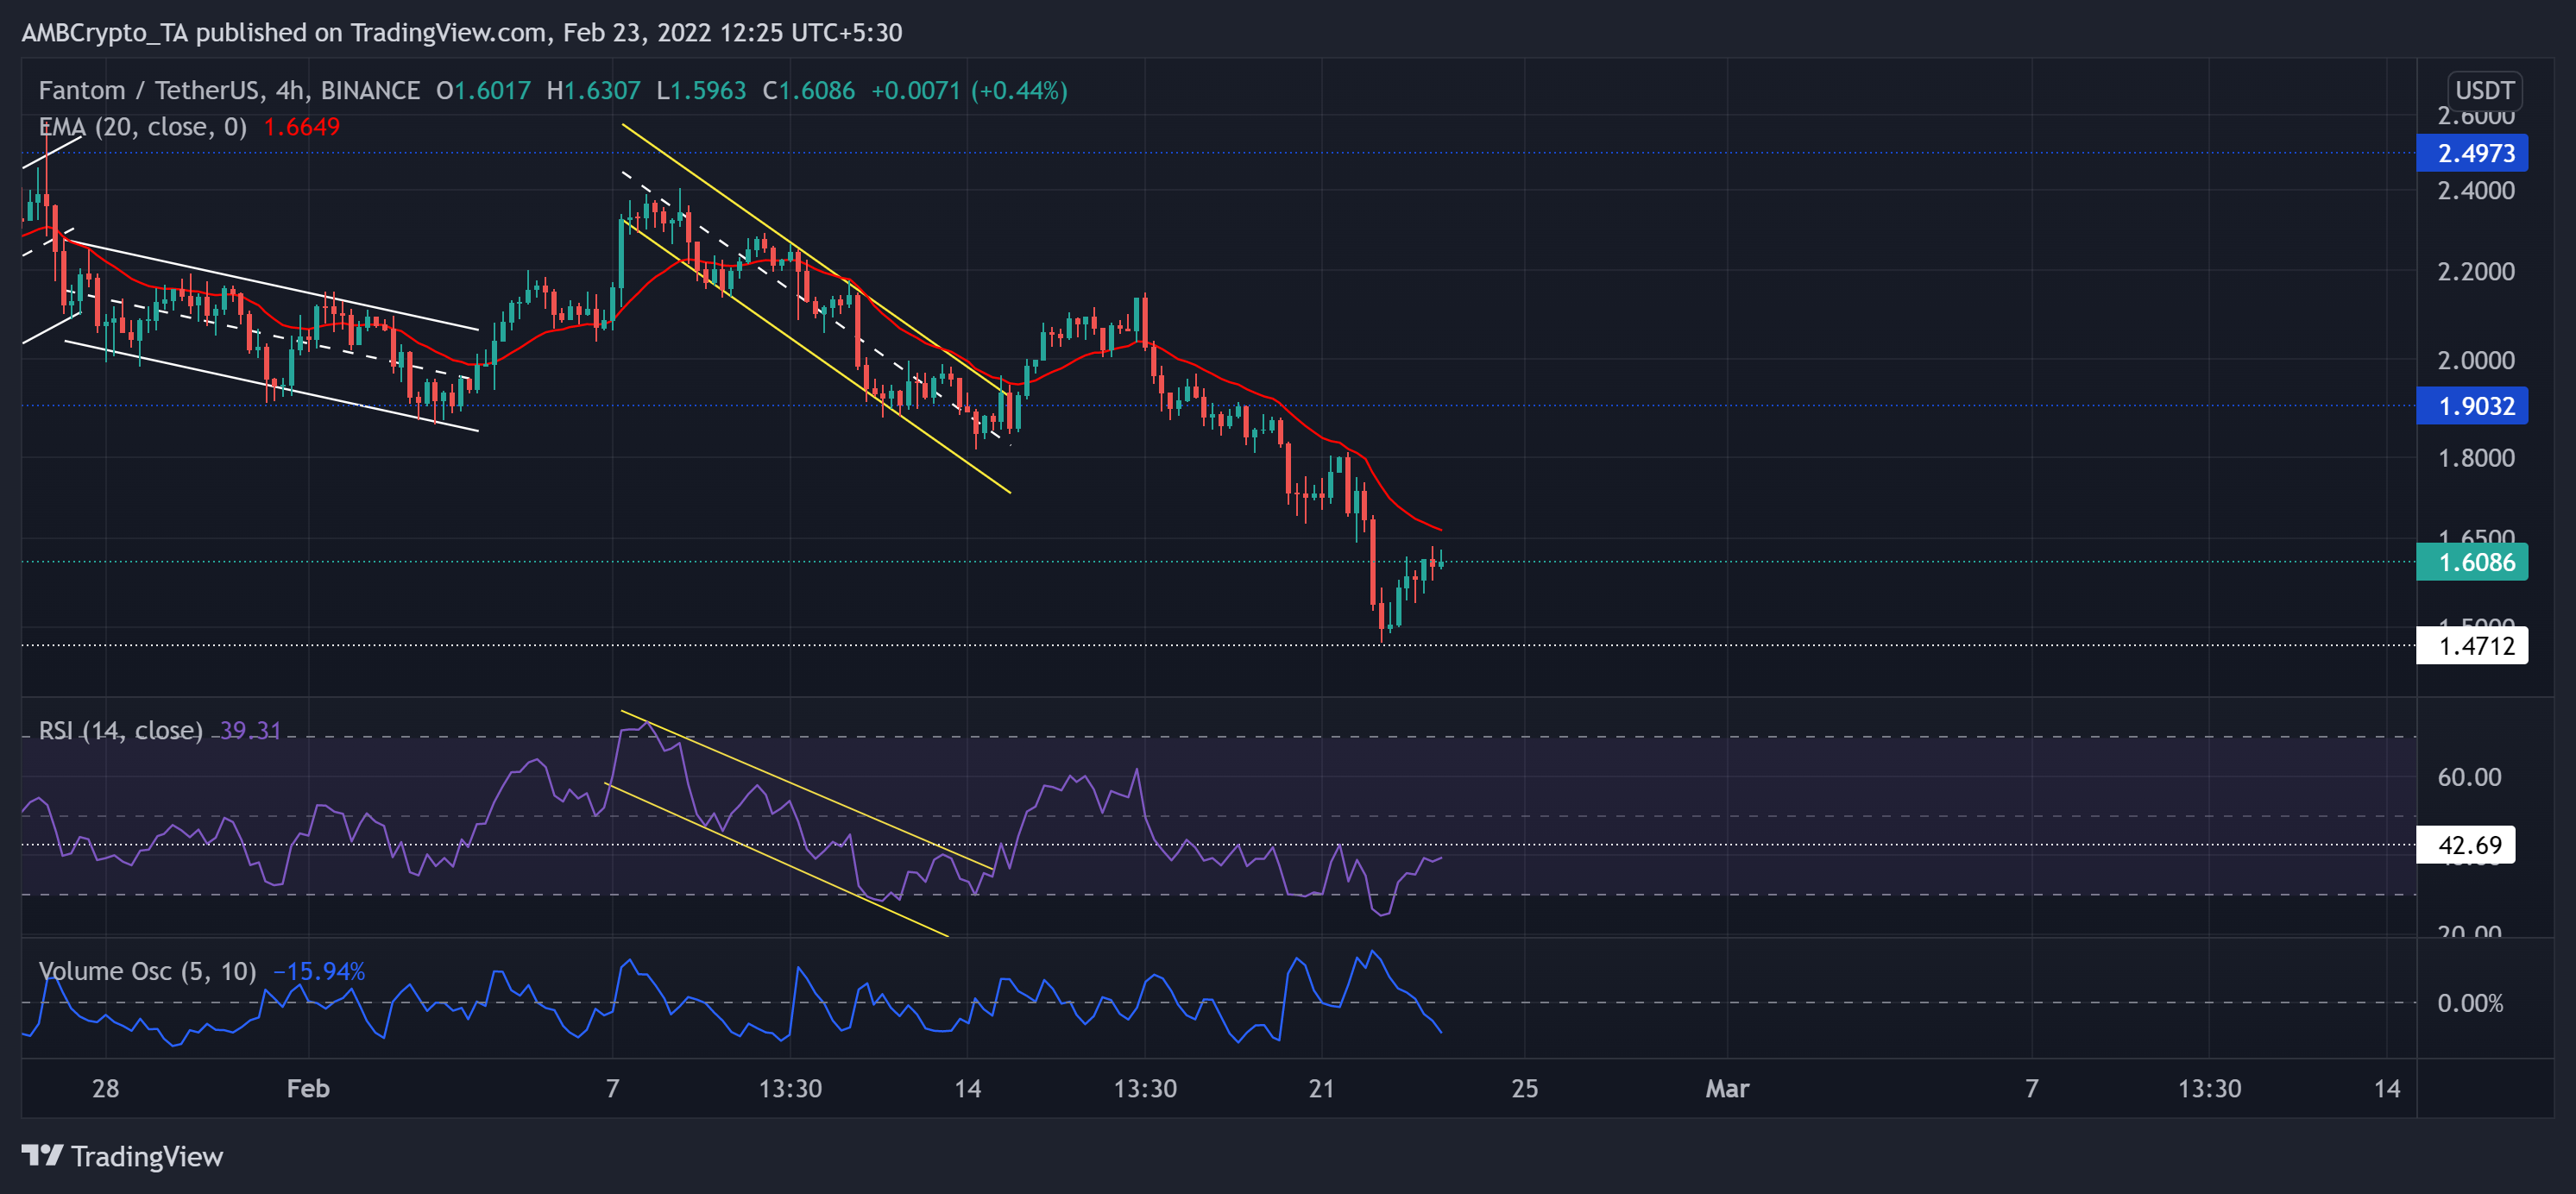
Since FTM reversed from the $3.32-level, the bears displayed their dominance. Consequently, it lost over 56% of its value and hit its two-month low on 22 February.
During the downfall, the alt was range-bound between the $2.49 and $1.9-mark. While maintaining the $1.9-mark, FTM kept marking lower peaks until it breached it to hit its February low. Now, it eyed to retest its 20 SMA (red) at the $1.6-mark (immediate resistance).
At press time, FTM was trading at $1.6086. The RSI saw a rapid recovery from the oversold region. Any close above the 42-point barrier would drive a push toward the half-line. However, the recent gains failed to entail increasing volumes, hinting at a weak bullish move.