

![The Solana [SOL] rally from $20 is not yet over as $23.5 is only a...](https://ambcrypto.com/wp-content/uploads/2023/02/PP-2-SOL-cover-1-1024x682.jpg)
Disclaimer: The information presented does not constitute financial, investment, trading, or other types of advice and is solely the writer’s opinion.
- Although the sentiment is bullish around Solana, the higher timeframe bias has not shifted.
- A breakout past the range highs was not yet in sight.
Bitcoin consolidated at the $21.6k mark for a few days. In the past couple of days, the price of BTC shot upward swiftly to reach $24.8k. The $24.8k-$25.2k is a zone of resistance from mid-August. Solana also posted strong gains over the past two days.
Is your portfolio green? Check the Solana Profit Calculator
The token registered gains of 22.6% from the lows on 13 February at $19.73, to the highs on 16 February at $24.2. This rally also broke above the mid-range mark. Can the bulls press their advantage?
Solana breaches $23.5 but long-term investors might not be interested yet
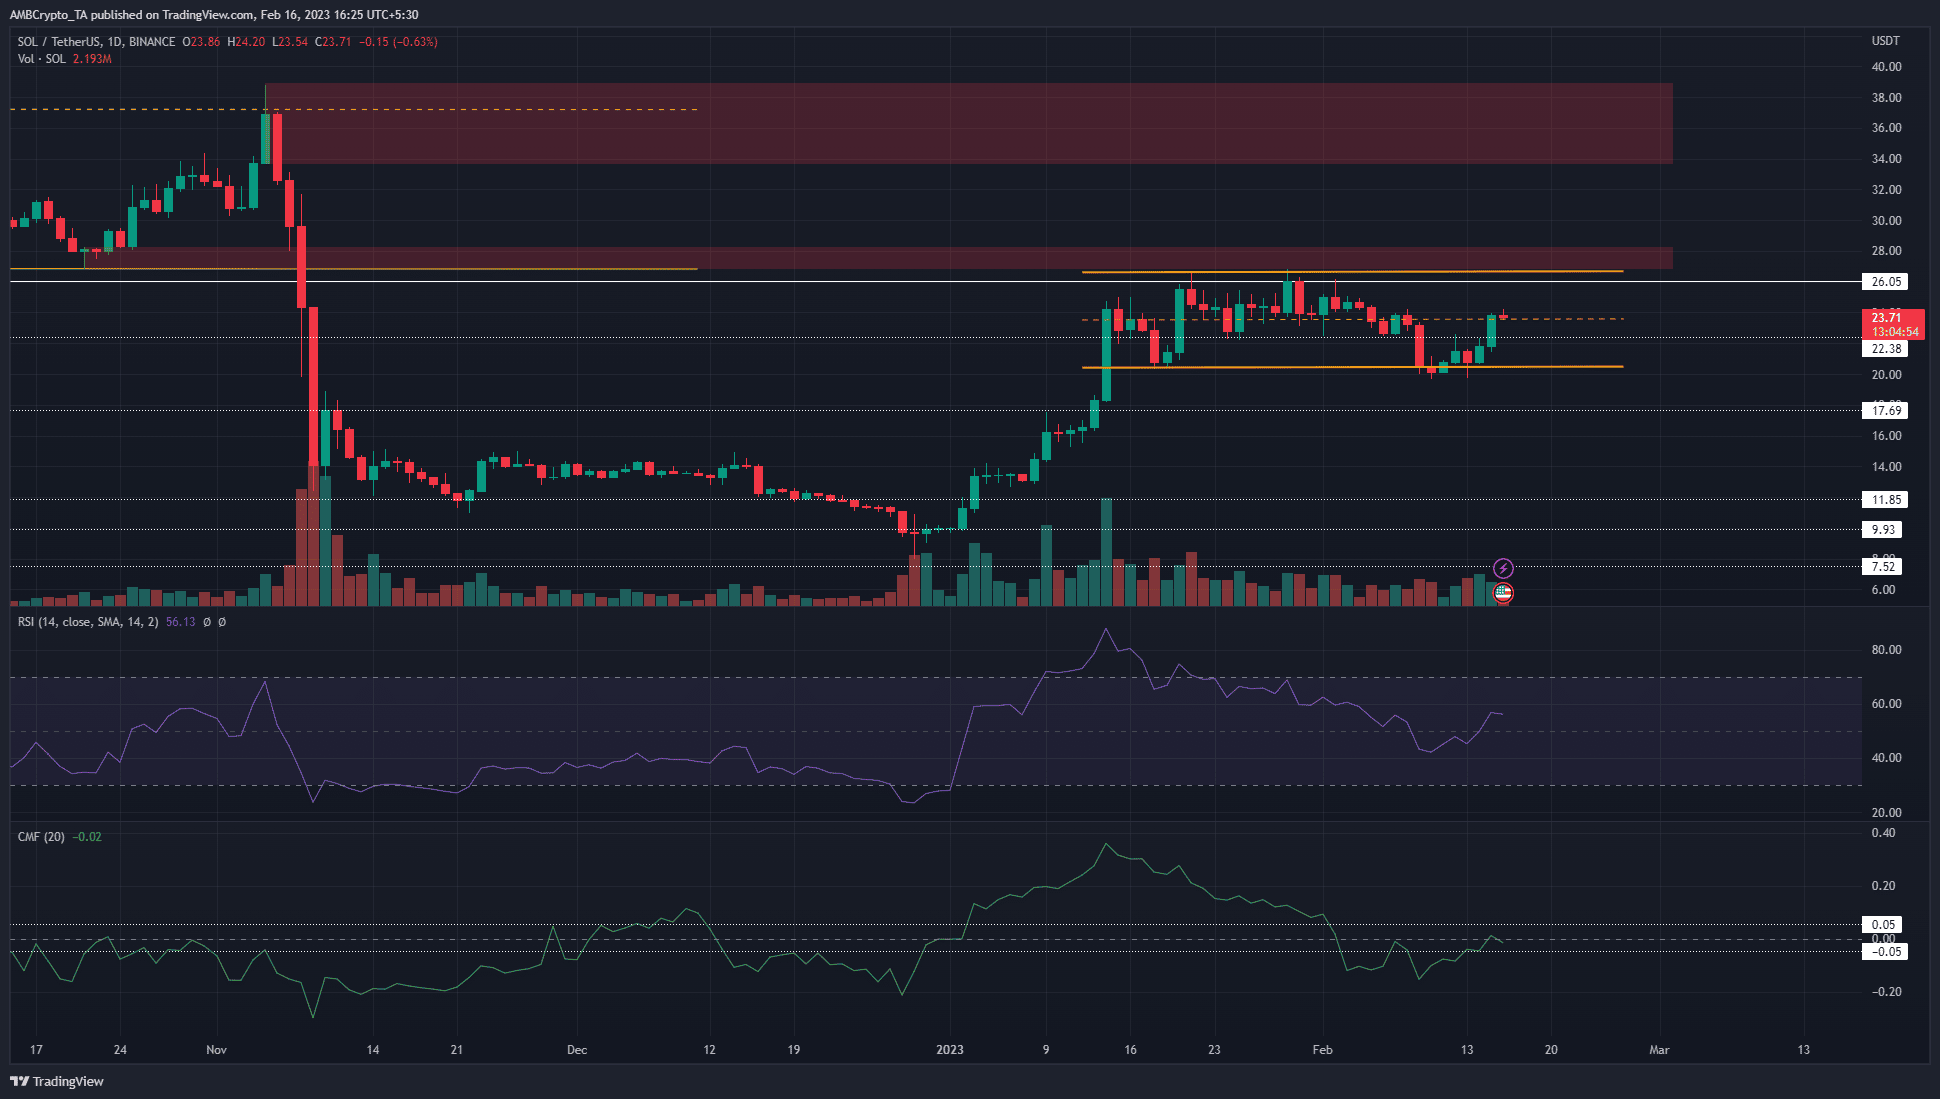
The recovery from $8 to reach $26.6 took a month. In the three weeks that followed, Solana traded within a range from $20.5 to $26.6. The mid-range mark at $23.55 has served as support and resistance in recent weeks. At the time of writing, SOL traded just above this level of resistance. The next few hours can see it flipped to support.
Lower timeframes showed that bulls can look to buy SOL at $23.55 and $22.4, with stop-losses set just 1% beneath either level. More risk-averse traders can wait for a move back above $24 and a subsequent retest of $23.55-$23.7 to buy SOL, targeting the range highs.
Realistic or not, here’s SOL’s market cap in BTC’s terms
On the higher timeframes, the range remained worth watching. Above the highs sat a daily bearish breaker at $27.5. Another bearish order block was spotted at $35. Investors can look to take profits on Solana in case of a move up to $28, and wait for a significant pullback to buy.
Sentiment shifted to bearish at the range lows but short sellers were punished
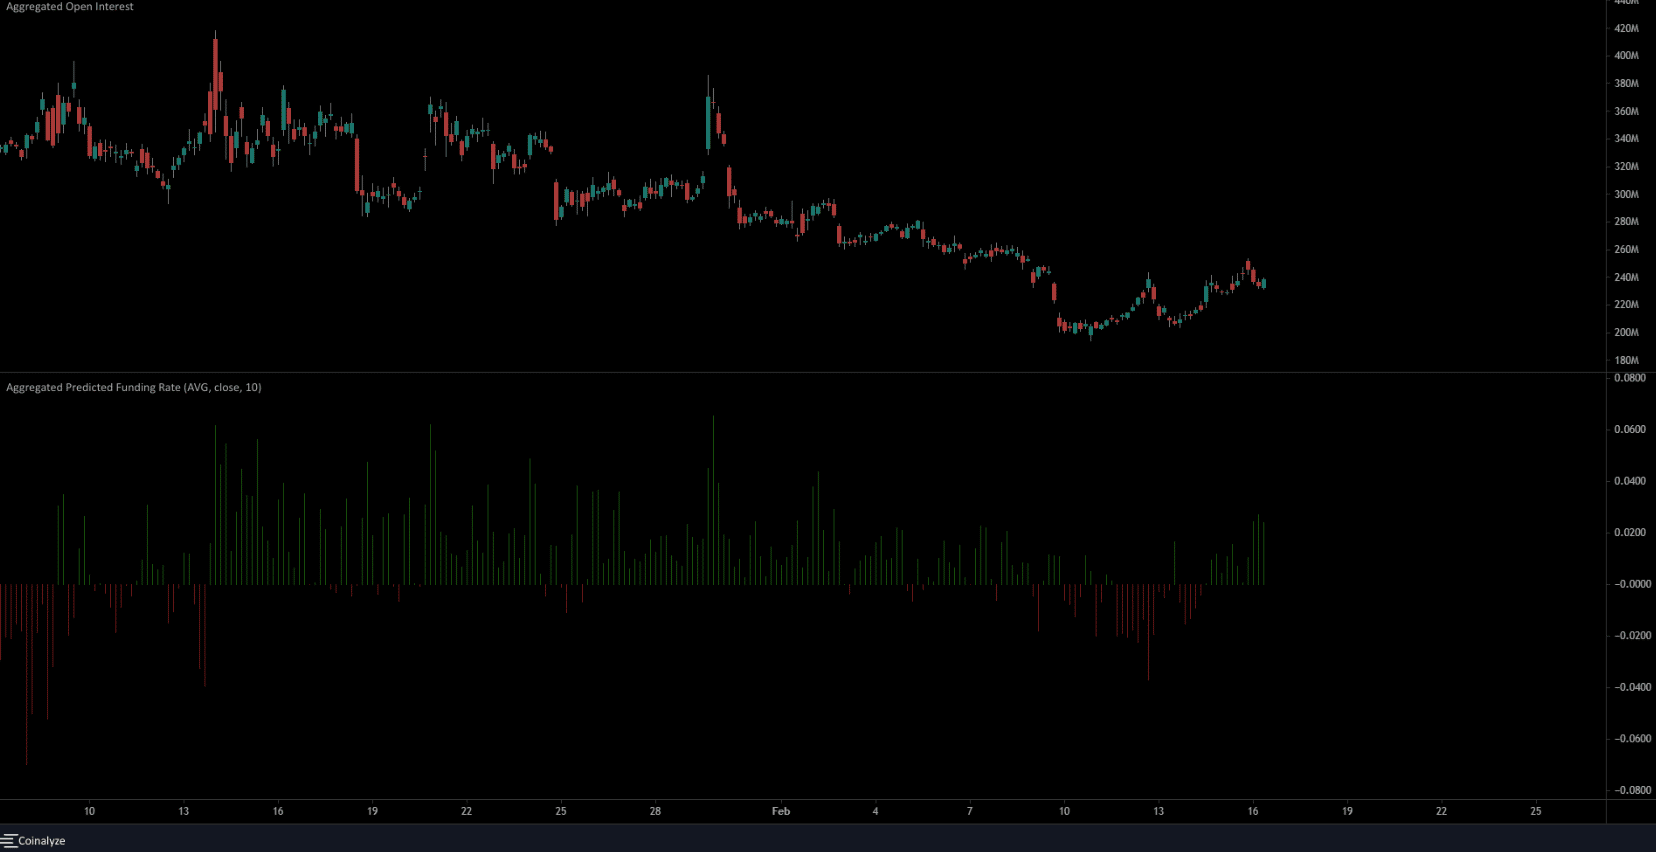
On the 4-hour chart, we see that the Open Interest has been sliding lower since late January. This corresponded with the price facing rejection at $26.6 and sliding toward the range lows at $20. Therefore, the inference was that the sentiment was bearish till 10 February. The predicted funding rate had also been negative then.
The past week showed sentiment might have shifted. The price rallied from the range lows. Alongside it, the OI also climbed to make higher highs.
This reinforced capital flow into the market and a bullish outlook. Moreover, the funding rate also flipped positive to show long position holders paid funding fees to the short sellers. Taken together, there was a likelihood that $23.5 and $22.4 will be defended as support over the next few days.