The to-do guide for Ethereum Classic’s bulls starts with this

Disclaimer: The findings of the following analysis are the sole opinions of the writer and should not be taken as investment advice
Since the first week of September, Ethereum Classic has had a rough time on the charts. Since ETC formed a double top at $77.4, massive drawdowns have been observed across the market. Trading at levels seen just after the 19 May sell-off at press time, ETC seemed extremely vulnerable to additional losses if buyers do not respond immediately.
Although a few bullish divergences on its indicators did induce some optimism, bulls face a tall task ahead of them. At the time of writing, ETC was valued at $48.1, down by 3.6% over the last 24 hours.
Ethereum Classic Hourly Chart
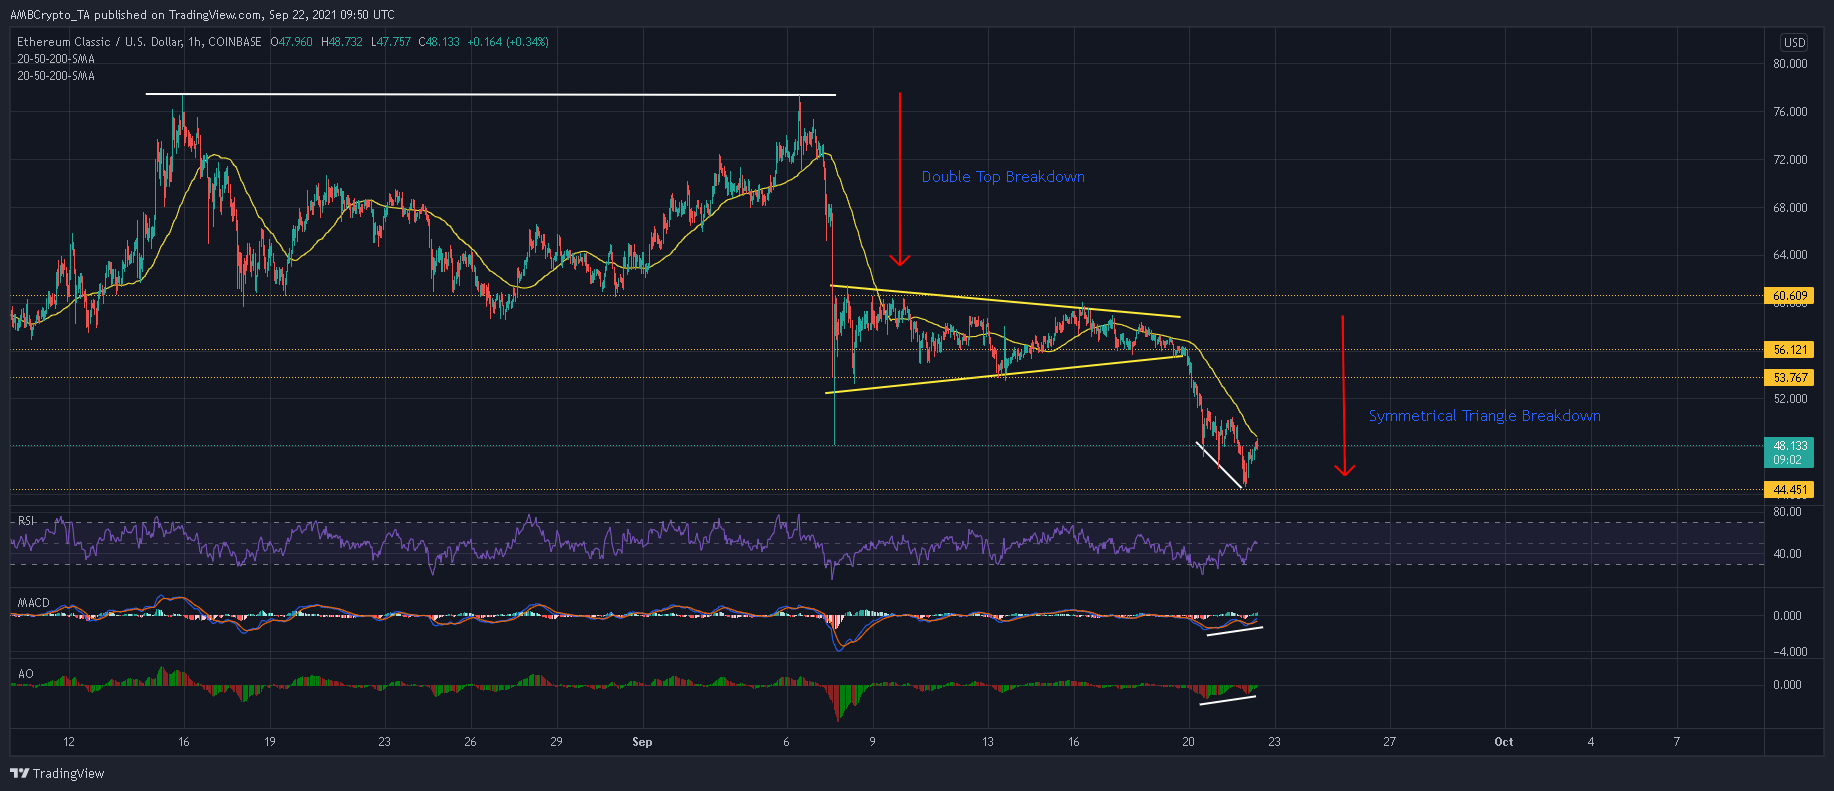
A couple of bearish patterns have really hurt ETC’s progression on the chart. A double pattern at $77.4 and a symmetrical triangle setup both played in favor of the bears and triggered sharp breakdowns. Overall, ETC’s value fell by 42% in the last two weeks due to these setups.
As a result of constant selling pressure, a single candle even closed below the daily 200-SMA (green) for the first time since December 2020. Retaking lost ground from here would be a tall order for the bulls.
As the market continues to bleed, support levels of $37.3 and $32 would take center stage. If losses are not contained above $32, ETC would be under the threat of a prolonger bear market. To overcome this situation, ETC needs to close above $56. This would open the doors for a rally back up to the $77-level.
Reasoning
ETC’s trajectory could be explained by its hourly RSI. The index, which bounced back from the oversold region, was unable to climb above 50 due to selling pressure. This suggested that there was severe weakness in the market and gains would be limited going forward.
Even the MACD and Awesome Oscillator traded below their respective half-lines – A reading which dissuaded buyers from taking up positions. Over here, it’s important to mention that each of the aforementioned indicators observed higher peaks over the last few sessions.
These bullish divergences did suggest that buyers were making some headway in terms of recovery, but the 50-SMA (yellow) can be expected to keep ETC in check.
Conclusion
ETC seemed open to drawdowns towards $37.3 and $32 if sellers keep up the pressure. Enforcing a recovery from such lows would be difficult for the bulls, especially if the broader market continues to be weak.
On the contrary, ETC needs to rise above $56.1 in order to attract buyers back to the market.