The where and how of SHIB traders making a profit here

Disclaimer: The findings of the following analysis are the sole opinions of the writer and should not be considered investment advice
The dog-themed token was on a steep downturn after attaining its ATH in October of last year. Thus, Shiba Inu (SHIB) declined between southbound parallel channels and fell below the vital liquidity range near the $0.033-zone. (SHIB prices: multiplied by 1000 from here on)
Assuming the 20 EMA (blue) stood sturdy, any close below its 200 EMA (yellow) would brace SHIB for a retest of its five-month trendline support (white, dashed) or its demand zone created near the $0.022-$0.02 range (rectangle). At press time, SHIB traded at $0.02538, down by 15.9% in the last week.
SHIB Daily Chart
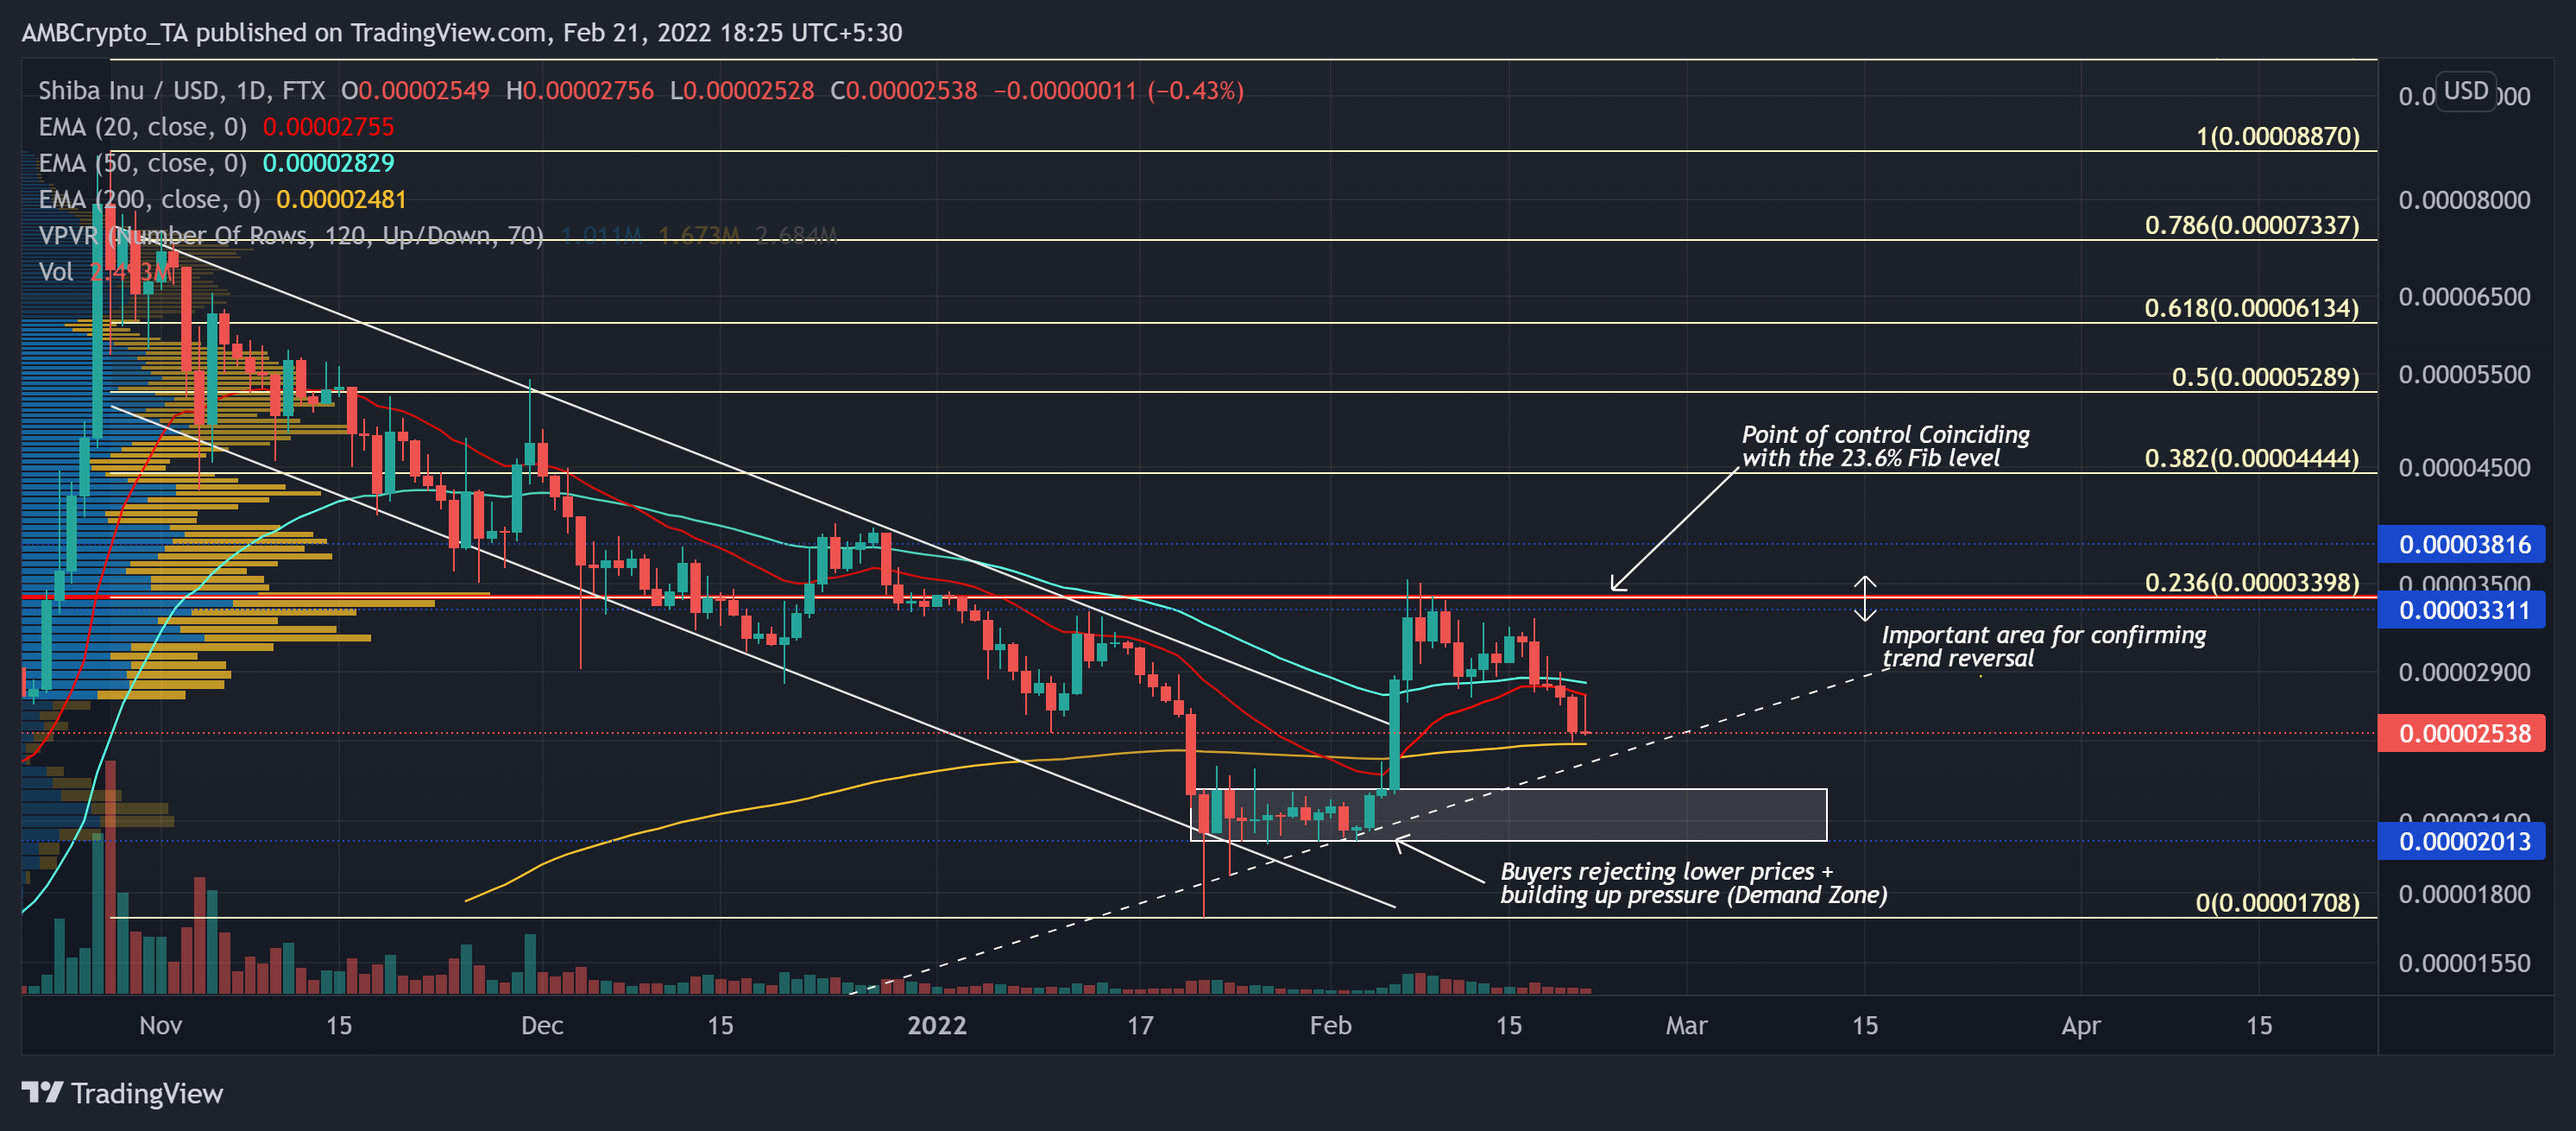
During this bearish phase, SHIB lost its crucial Point of Control (red, horizontal) near the $0.033-level and fell below its 200 EMA (yellow). Additionally, this level coincided with the 23.6% Fibonacci resistance. The fall halted at the $0.02-mark that the buyers upheld for over four months.
Consequently, the price entered a tight phase while the bulls started building up pressure and rejecting the lower prices. Thus, it saw over 70% gains from 3 to 9 February and broke out of the down-channel while the 23.6% level stood strong. Over the last few days, the pullback volumes have exceeded the recovery volumes, hinting at a strong bear move.
Going forward, SHIB aimed to test its five-month trendline support before a likely test of its demand zone ensuring floor at the $0.02-level. Post which, the bullish comebacks would continue to find a ceiling at its Point of control.
Rationale
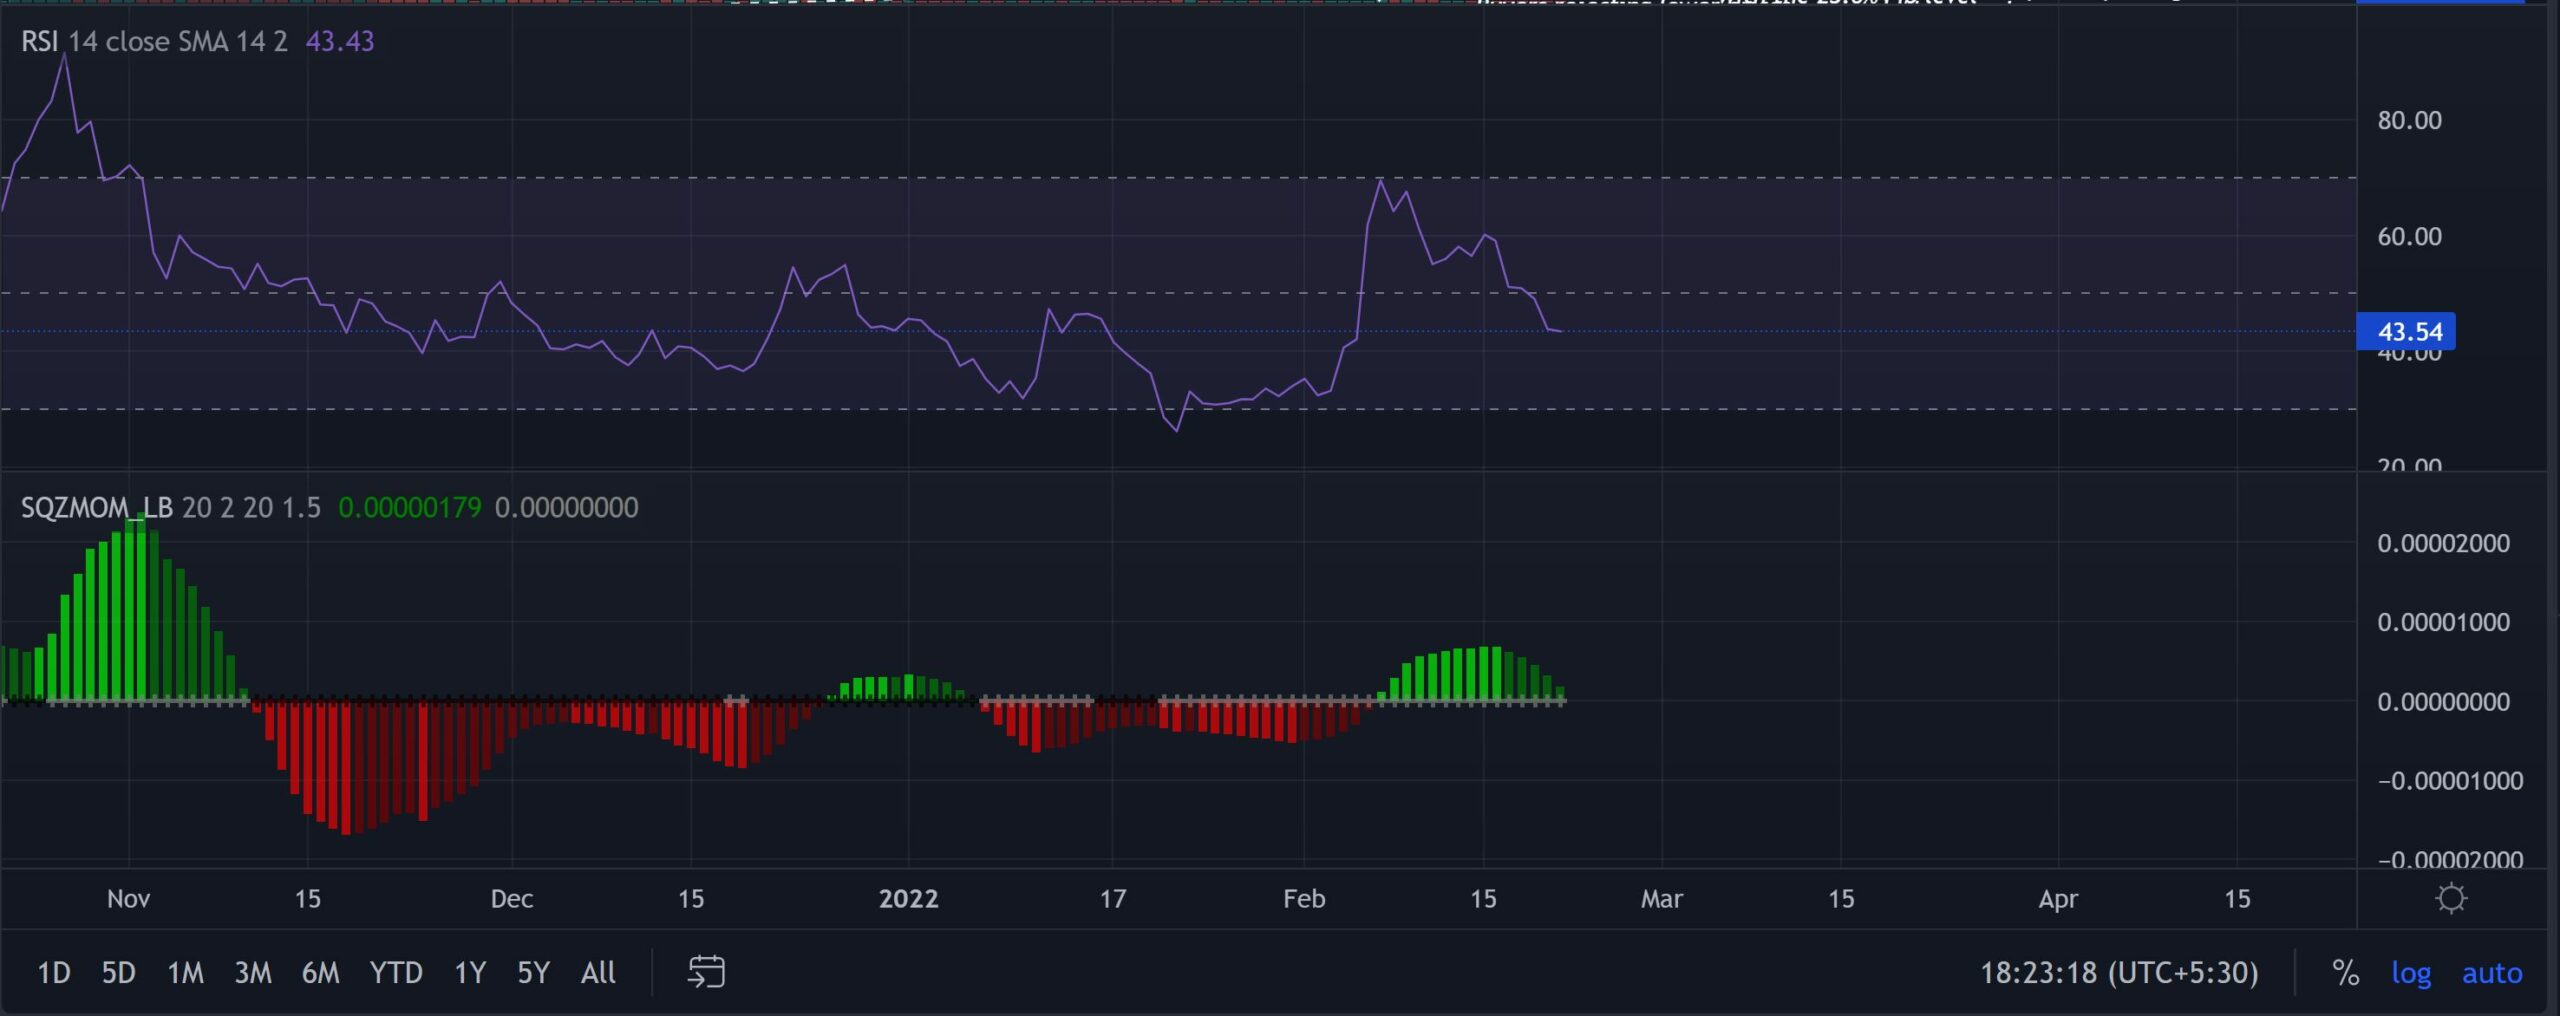
The RSI corresponded with the price and swayed below the midline, revealing a bearish edge. Any close below the 43-support would open up the gates for demand zone retest.
Interestingly the Squeeze Momentum indicator has been in a high volatility phase for the last month. Any black dot on its daily chart would hint at a tight/ low volatility phase in the coming days.
Conclusion
Keeping in mind the recent rejection of higher prices, a retest between the $0.022-$0.02 before picking itself up to challenge its liquidity zone would be likely. Any fall below the demand zone would entail selling signals.
Besides, the alt shared an 89% 30-day correlation with Bitcoin. Hence, keeping an eye on Bitcoin’s movement with the overall market sentiment would be essential to make a profitable move.


