These are the levels Bitcoin traders should keep an eye on now

Disclaimer: The findings of the following analysis are the sole opinions of the writer and should not be taken as investment advice
Bitcoin’s close above $48,000 was an important development. It allowed the price to respect its bottom trendline which extended from its late-July lows. However, some indicators did not concur with BTC’s price action. As buyers looked to restore a bullish long-term narrative, certain resistance zones had the potential to trigger a sharp retracement in the market.
At the time of writing, Bitcoin was trading at $48,909, up by 4% over the last 24 hours.
Bitcoin Daily Chart
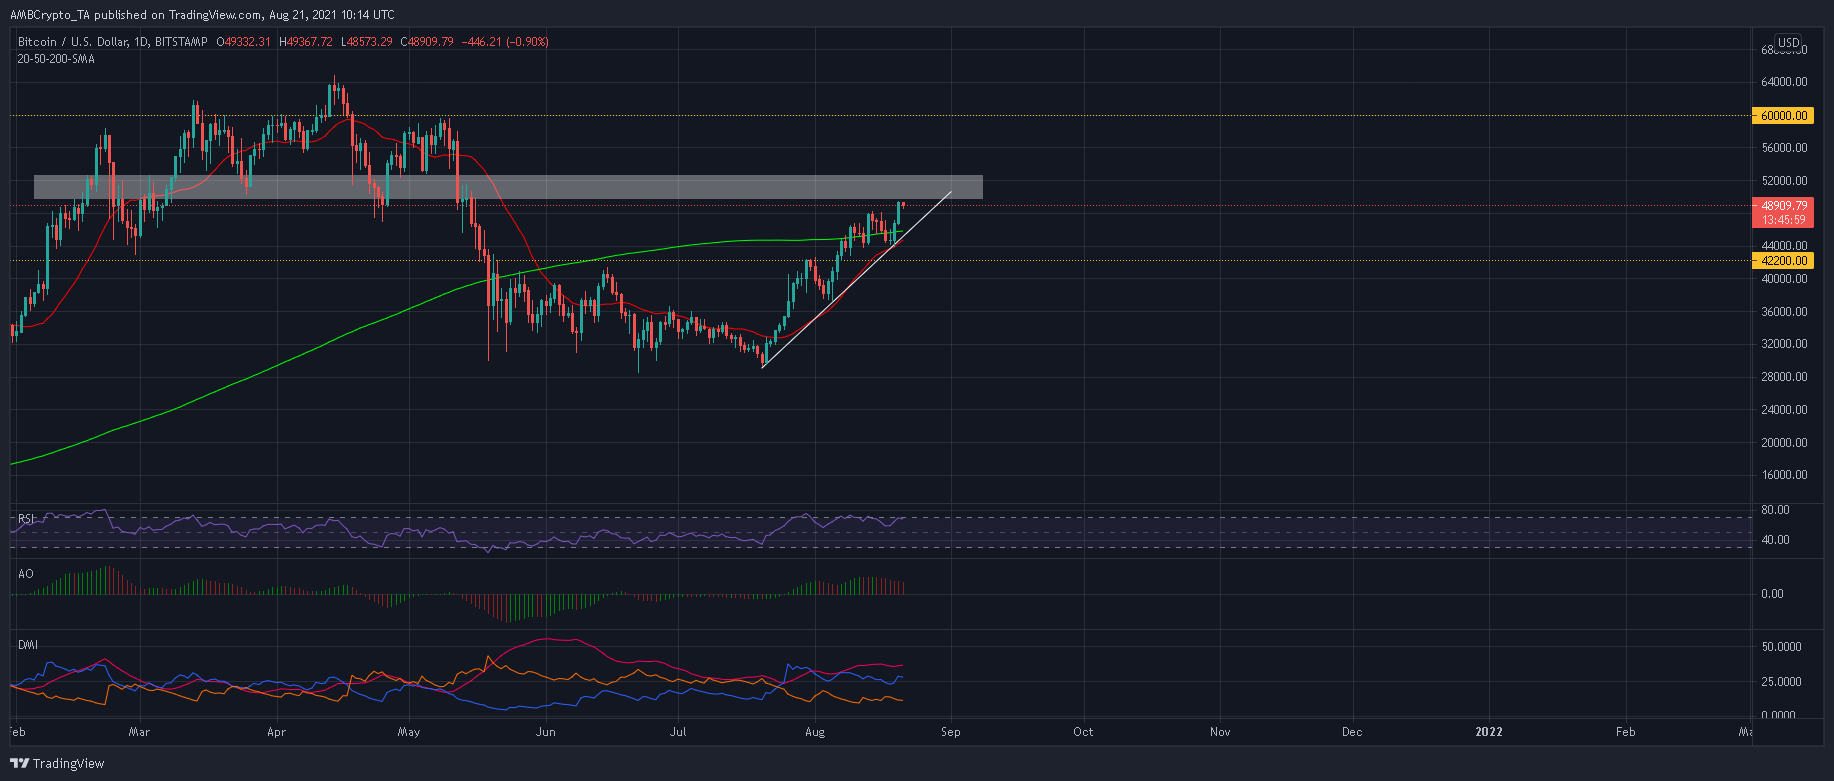
Only a few would say that Bitcoin is in an unfavorable position on the charts. The crypto’s price has formed higher highs and higher lows since late July as buyers sustained BTC above several key levels of $37,000, $42,000, and $44,000. The 20-SMA (red), which if often used to gauge the short-mid term trends, has moved bullish for nearly a month, providing support on some occasions.
A golden crossover was close to completion- an event that would inject further bullish sentiment into the market.
Additional levels to watch out for lay at $50,000, $51,000 and $52,600. These levels also posed a few risks as either could invite a sharp wave of selling pressure, especially since a few indicators failed to advance beyond certain levels. In case of a retracement, support levels at $42,200 and $41,000 would once again be under the spotlight.
Reasoning
Despite BTC’s uptrend, the Relative Strength Index had not moved above 70-72. This pointed to some bearish divergence with respect to BTC’s price action.
The Awesome Oscillator was also unimpressed with the crypto’s rise and continued to register red bars over the past few days. To combat such signals, the Directional Movement Index upheld its bullish position as the +DI line traded above the -DI line. An asset’s trend is usually preserved till the DMI notes a crossover.
Conclusion
Bitcoin needs to make some headway before rising towards its May highs. Areas to watch out for in the coming week lay at $49,700, $51,000, and $52,600. However, any of these levels could trigger the next market correction. Meanwhile, traders must be on alert for a close below $41,000 as this would alter BTC’s bullish narrative.