These signs indicate that Solana is due for an immediate reversal

Solana has extended its correction for five days, having lost 13% of its value from an all-time high of $260. With the MACD and RSI lining up chances of further losses yet, SOL could stretch towards the 50% Fibonacci level, over the near-term.
As the Bollinger Bands and RSI reach oversold territory, expect bulls to mount a comeback before SOL tags its defenses below $218.3. At the time of writing, SOL traded at $227.4, down by 6% over the last 24 hours.
Solana 4-hour Chart
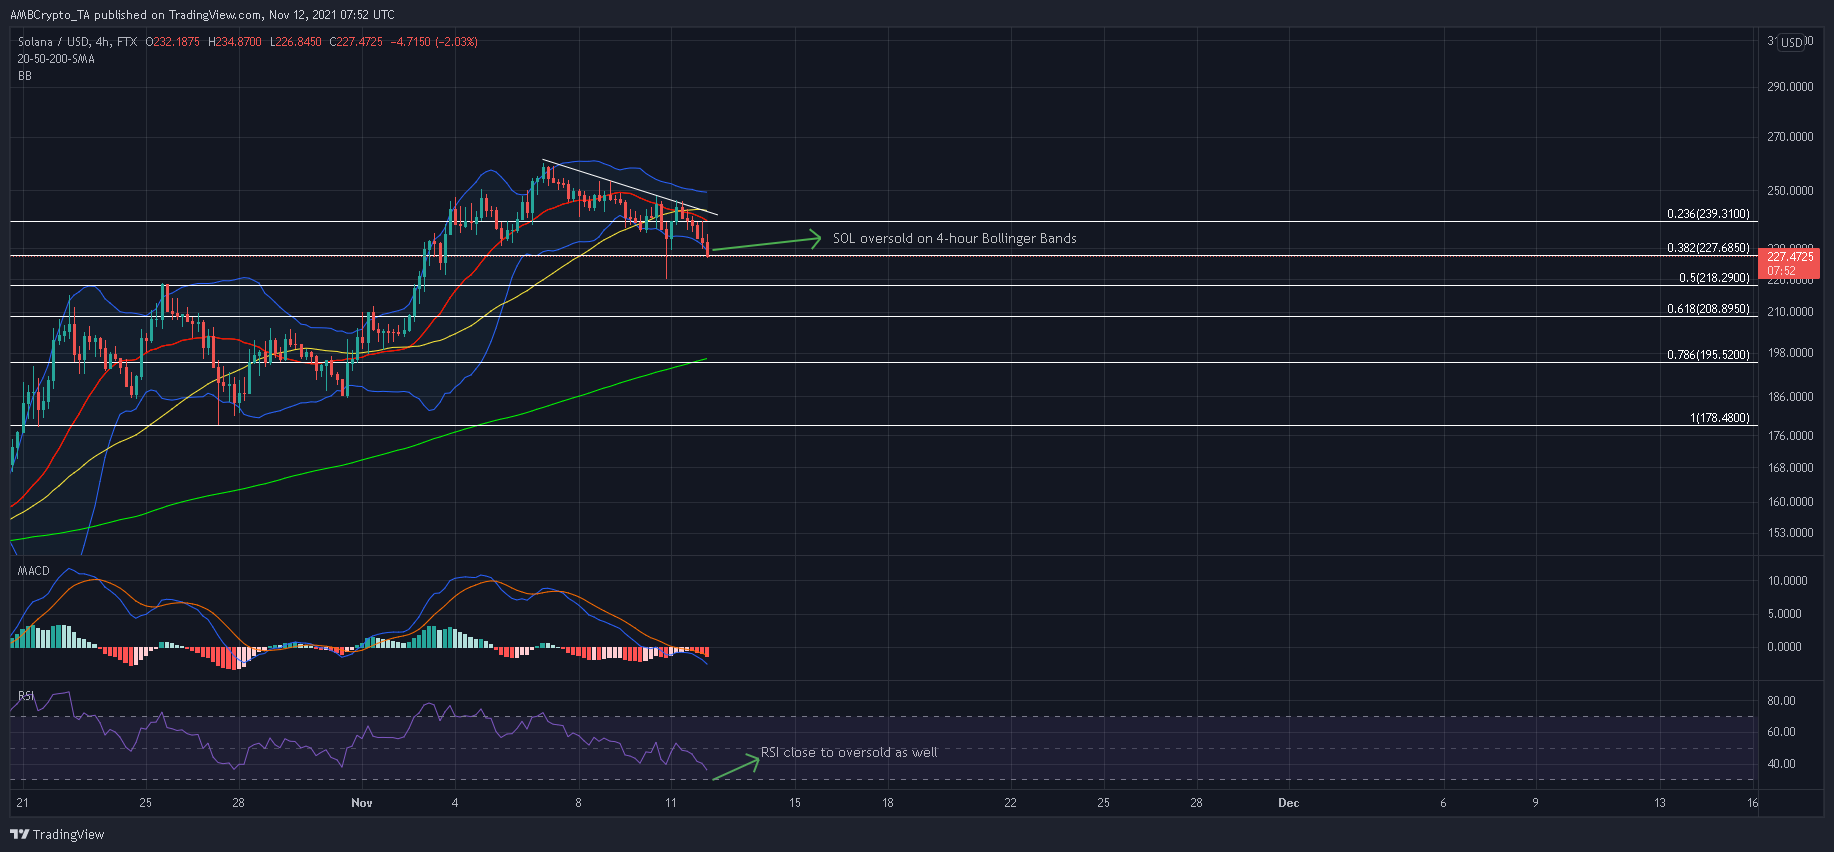
Considering a bearish crossover between the 50-SMA (yellow) and 20-SMA (red) , SOL could weaken below the 38.2% Fibonacci level as sellers continue to drive the market. Should a double bottom at $220 fail to prop SOL back up on the chart, the price would be exposed to another 5% sell-off towards the 50% Fibonacci level.
Additionally, the 61.8% and 78.6% Fibonacci levels could help generate a bullish reversal as well. The former support area coincided with the 12-hour 50-SMA (not shown) while the latter clashed with the 4-hour 200-SMA (green). In case sellers are able to drive past these defenses, SOL’s downtrend could stretch all the way to its September lows of $124.15 or even $115.88.
Reasoning
There were a few interesting observations on SOL’s indicators despite bearish readings. For instance, SOL was oversold after trading on the lower band of the Bollinger Bands and was due for a reversal. SOL was not far away from the oversold territory on its 4-hour RSI as well.
Such readings could allow buyers to inject momentum back into the market. On the downside, MACD would not lend a helping hand to bullish traders. The index was trading at a 1-month low and showed no signs of a reversal in movement just yet.
Conclusion
The 38.2% Fibonacci level and a double top at $220 were SOL’s best chances of an immediate reversal. Oversold readings on the Bollinger Bands and RSI would aid buyers in a recovery as well. However, traders should be cautious of a close below the 78.6% Fibonacci level as this could transpire into heavy losses over the longer run.