This could trigger a strong upward push for Bitcoin Cash

Bitcoin Cash’s recovery post a symmetrical triangle breakdown seems to have been short-lived. While the 200-SMA (green) did come into play briefly, as BCH tested $600-support, gains stood just short of $700. Another wave of selling pressure was currently in effect and BCH eyed a throwback to its 200-SMA once again. At the time of writing, BCH traded at $625, down by 2.3% over the last 24 hours.
BCH 4-hour Chart
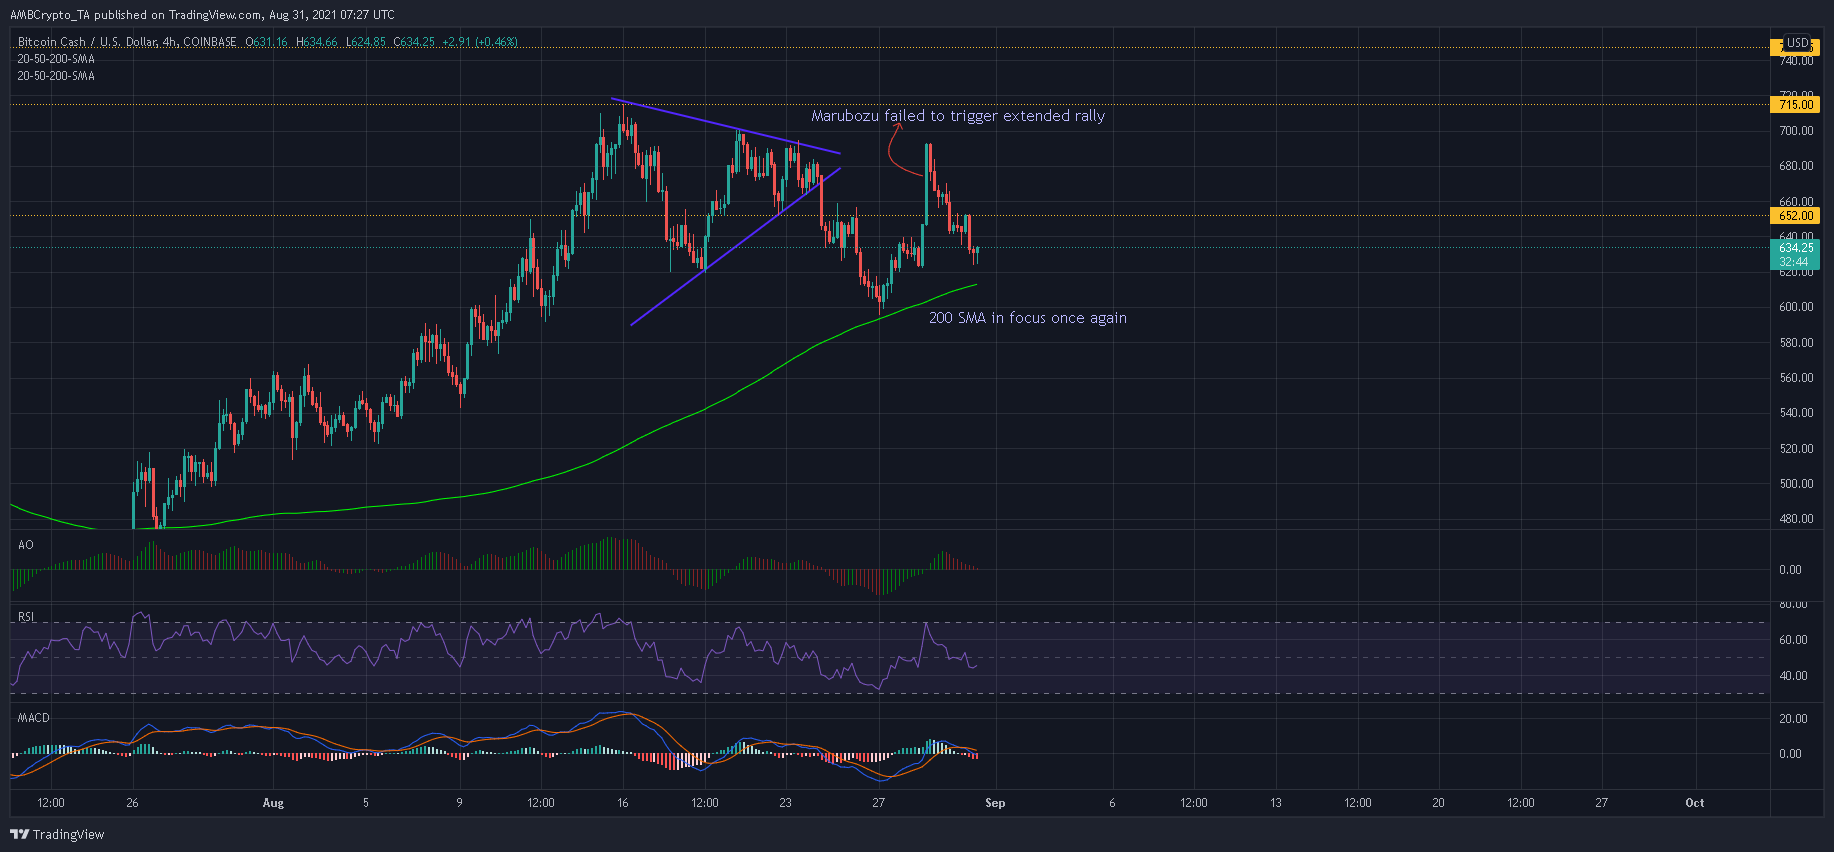
Although a bullish marubozu lined on BCH’s chart and denoted a strong session for buyers, profit-taking set in at $695-resistance. As a result, prices dropped below the key support of $652, which invited some more short-selling.
In fact, this downwards pressure is likely to continue till BCH reaches a defensive zone between $615-$620. A bullish reversal and throwback towards $650 would be the best-case outcome in the near-term. A more optimistic target can be set at $695, from where a local high of $715 can be achieved.
Reasoning
Before chances of a price reversal, it was important to understand where BCH’s indicators currently sat at. The Relative Strength Index continued its southwards journey from a 2-week high and shifted into bearish territory. A drop below 40 would indicate further downside moving forward.
The Awesome Oscillator threatened to fall below the half-line- a development that normally functions as a sell signal. Finally, the MACD did not fare any better and also threatened a dip below its equilibrium. If these signals do develop into an extended decline, support areas of $600 and $550 would come to light.
However, these indicators could easily reverse their projections if buyers react strongly at the 200-SMA. Traders should keep a close eye over the coming sessions for some more clarity.
Conclusion
Selling pressure might not dissipate till BCH approaches a support zone between $615-$620, which was backed by the 4-hour 200-SMA. The long term moving average line could trigger a strong upwards response and levels such as $650 and $695 must be observed for a best-case outcome. Traders can opt to long BCH between the aforementioned support to maximize their profits.