This Ethereum Classic level could see further demand only if…

Disclaimer: The findings of this analysis are the sole opinions of the writer and should not be considered investment advice
In late January and early February, Ethereum Classic appeared to break its long-term downtrend as it climbed from its $21.9 lows to $37.5 highs. This was a little more than 70% in gains over a time period of nearly three weeks. Alas, since then, Ethereum Classic has turned south on the charts.
At the time of writing, the bearish market structure appeared to be on the verge of shifting towards the bullish side.
ETC- 1 hour chart
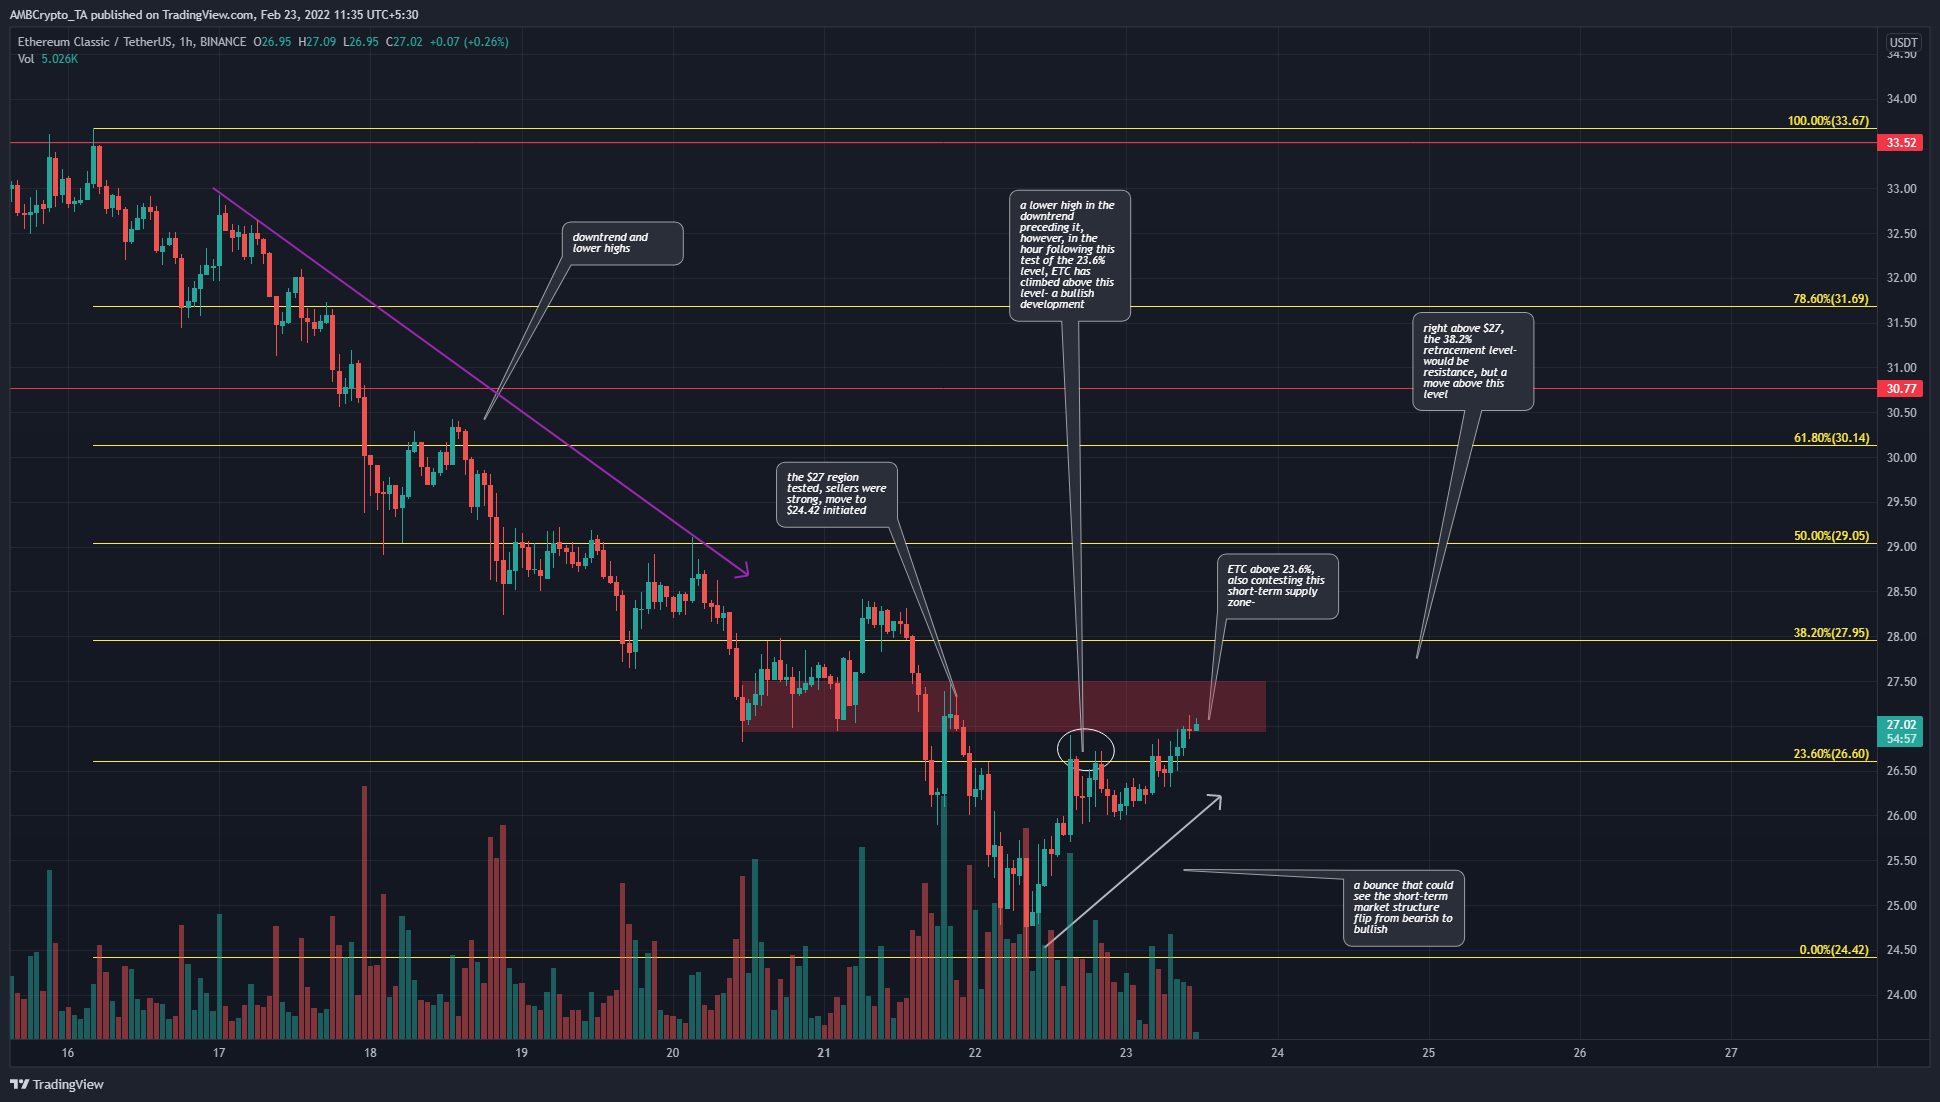
On the charts, we can see a series of lower highs since mid-February, characterizing a downtrend. Over the past couple of days, the $26.95-$27.5 (red box) area has seen demand arrive, but subsequently, the price fell below this area. ETC tested it as an area of supply before descending to the local lows at $24.42, where it has bounced from.
A set of Fibonacci retracement levels (yellow) were plotted based on ETC’s drop from $33.67 to $24.42 and the $26.6 level presented itself as the 23.6% retracement of this drop. Over the past few hours, the price has climbed above $26.6 – A bullish development.
There is still some way to go for the bulls – The $27.5-area and the $27.95-level above it are also places where selling pressure could appear in the near term. A move above the $28-area and its retest could offer a buying opportunity in the next couple of days.
Rationale
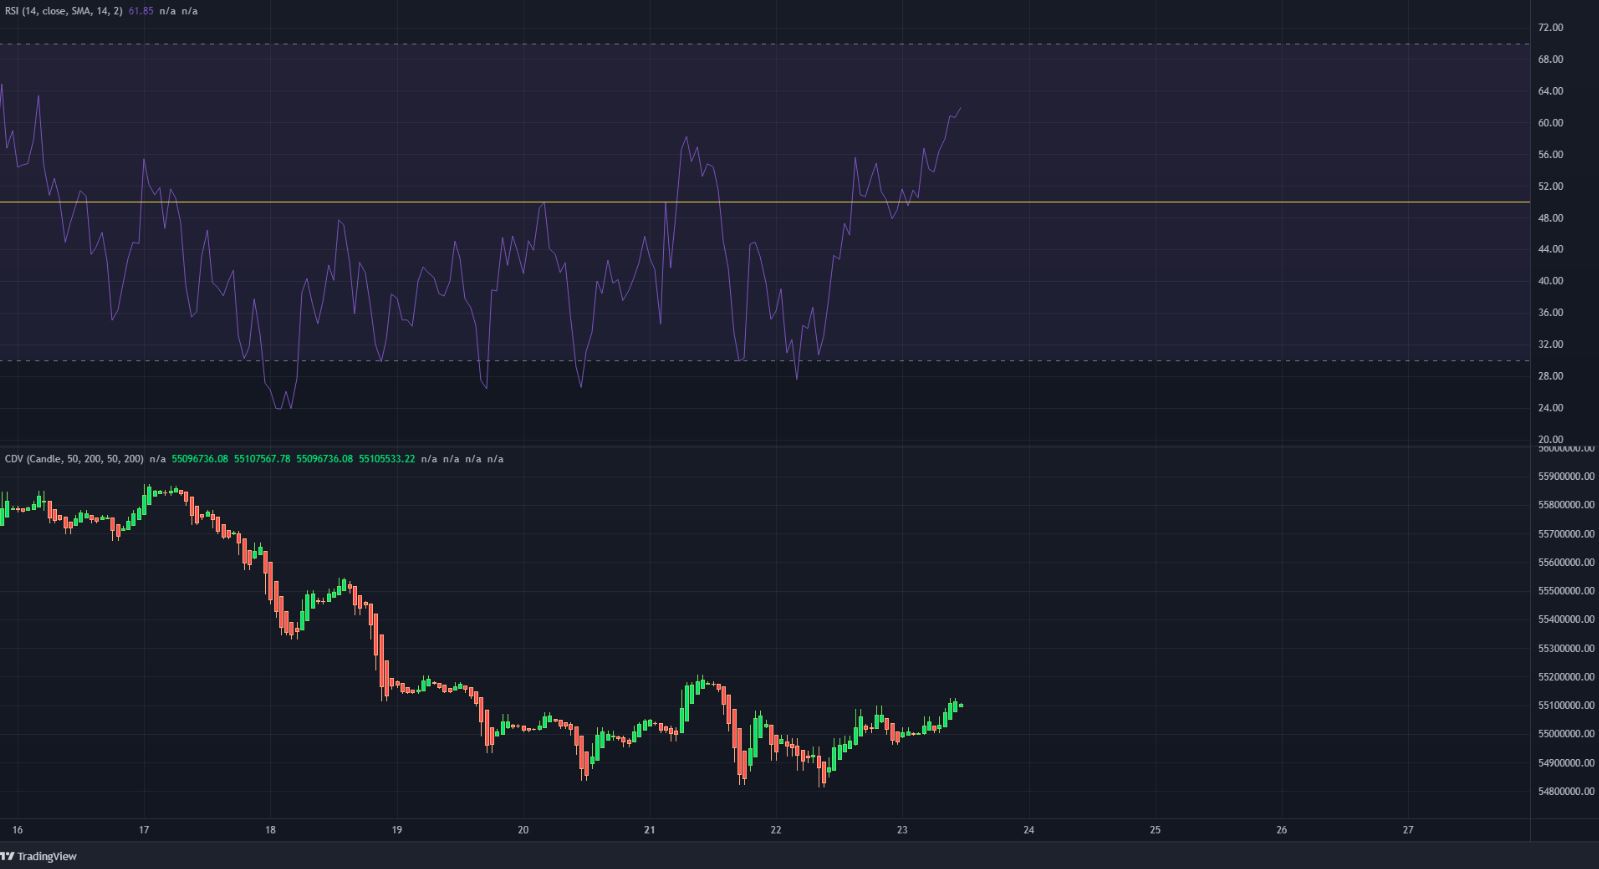
The RSI on the hourly chart rose above neutral 50 and retested it as support the previous day. This could be an early sign that momentum has indeed shifted from bearish to bullish.
The Cumulative Delta Volume indicator showed that buying volume has picked up in the past few hours. This underlined that demand was present behind ETC’s hike above $26.6. However, the sellers have been dominant over the past few days. Ergo, caution is warranted.
Conclusion
A move above $28 could be a safe buying opportunity for risk-averse market participants with a low timeframe preference. Such a move would strengthen the position of the bulls and would be a strong sign that the market structure has indeed flipped in favor of them.