
- Ethereum exchange reserves recently dipped to a critical low point
- Key signs seemed to point towards a potential short-term bounce at key level
Ethereum bears have maintained their dominance for the last 3 months, but how much longer can they keep it up? Well, recent data suggests potential accumulation as ETH flows out of exchanges, highlighting the state of demand at lower prices.
According to Glassnode, Ethereum has been flowing out of exchanges. Even more noteworthy is the recent ETH reserve lows which recently retested levels previously seen in 2016. Low exchange reserves may have contributed to ETH’s robust price action in the following year (2017). Hence, the question – Can history repeat itself?
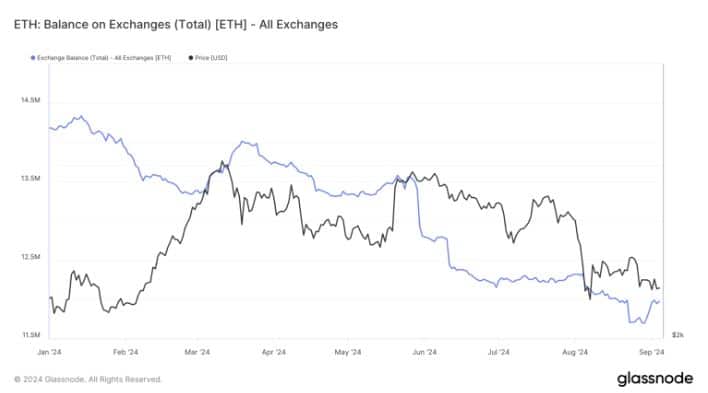
Source: Glassnode
A historical analysis of Ethereum in 2016 revealed that it did experience some headwinds. ETH’s price peaked at $18.36 in June 2016, before dropping below $12 in September of the same year. It even fell to as low as $7.14 by December of the same year, before embarking on an epic rally in 2017.
If Ethereum pursues a similar path in 2024, then it might point to the possibility that 2025 may bring forth a strong rally. The fact that ETH has been flowing out of exchanges confirms the presence of strong demand at discounted prices. Additionally, the pace of ETH flows has also been rising.
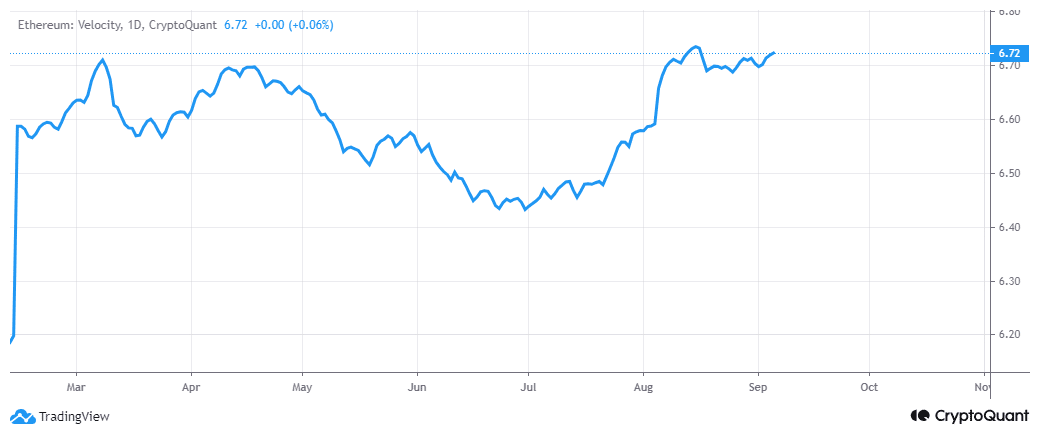
Source: CryptoQuant
Ethereum’s velocity has been trending upwards since July. A short-term bullish pivot could be in the making if this trend continues, coupled with robust demand.
However, on-chain activity revealed that demand is yet to reach an inflection point where it will outweigh supply.
Can Ethereum’s demand push for a pivot?
According to Ethereum’s address data, ETH addresses have been seeing more outflows than inflows. There were 204,000 active sending addresses versus almost 188,000 receiving addresses, at the time of writing.
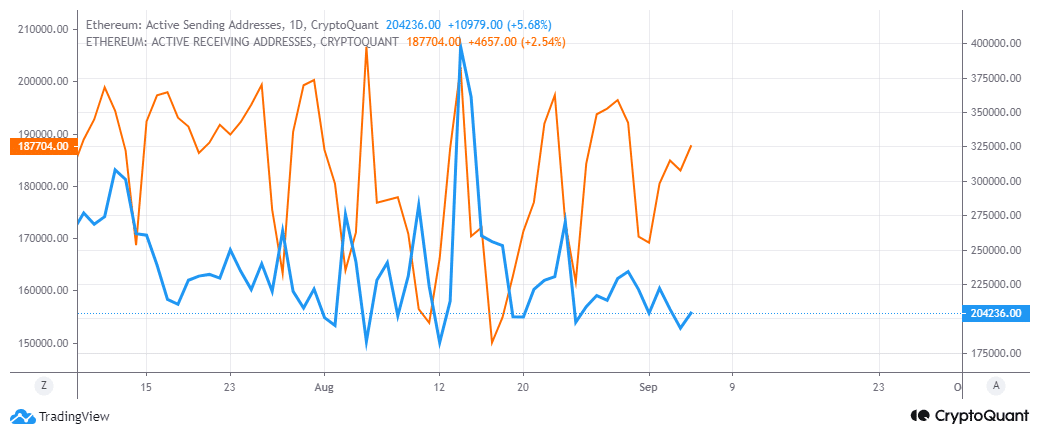
Source: CryptoQuant
Nevertheless, active addresses data also revealed another interesting observation.
In the last 2 weeks or so, active receiving addresses have been rising, while active sending addresses have been declining. This observation could signal a shift in the supply and demand dynamics. Moreover, this could be due to ETH’s prevailing price level.
ETH’s latest downside pushed the price into a noteworthy support level near the $2,333 price range. This may be a sign that there are growing expectations of a pivot around the same price range. Especially as bears ease off their assault.
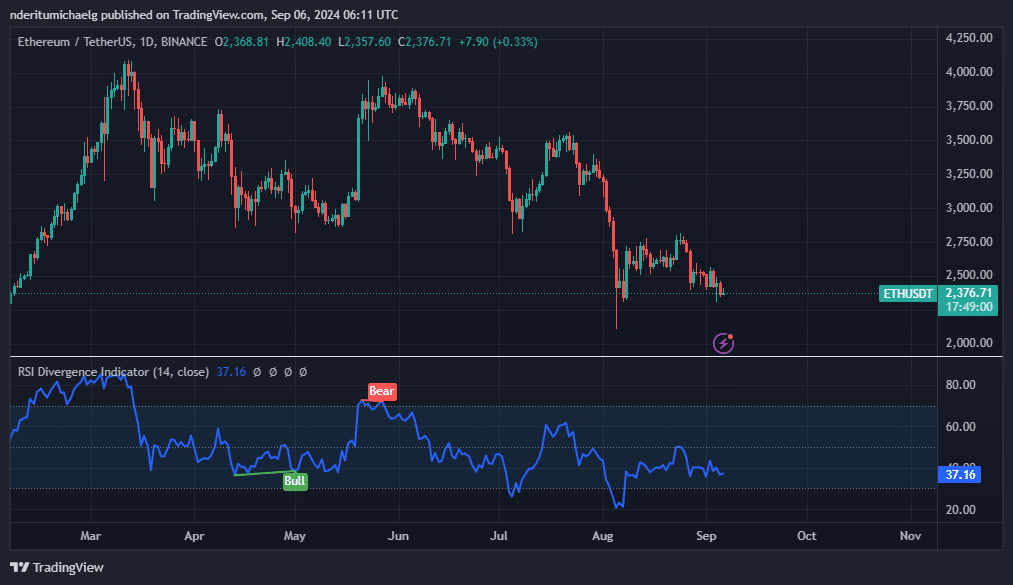
Source: TradingView
Despite these observations, however, the 1-day chart signaled that the bulls are yet to come out swinging.
Besides, the RSI indicated that the overall trend will remain in favor of the bears, with room for more potential downside too. Possibly towards the lowest price levels seen in August.


![dogwifhat's [WIF] 3-day rally has eyes glued, yet a hidden risk lurks](https://ambcrypto.com/wp-content/uploads/2025/04/Gladys-8-400x240.jpg)