This pattern suggests that Bitcoin will surge to this level

After Bitcoin marked a near 3-month high after touching the $46,600 mark, the last few days have resulted in some rangebound movement. However, the formation of a newer high has solidified a broadening wedge pattern which presents tremendous upside moving forward. At the time of writing, BTC traded at $44,894, down by 2% over the last 24 hours.
Bitcoin Daily Chart
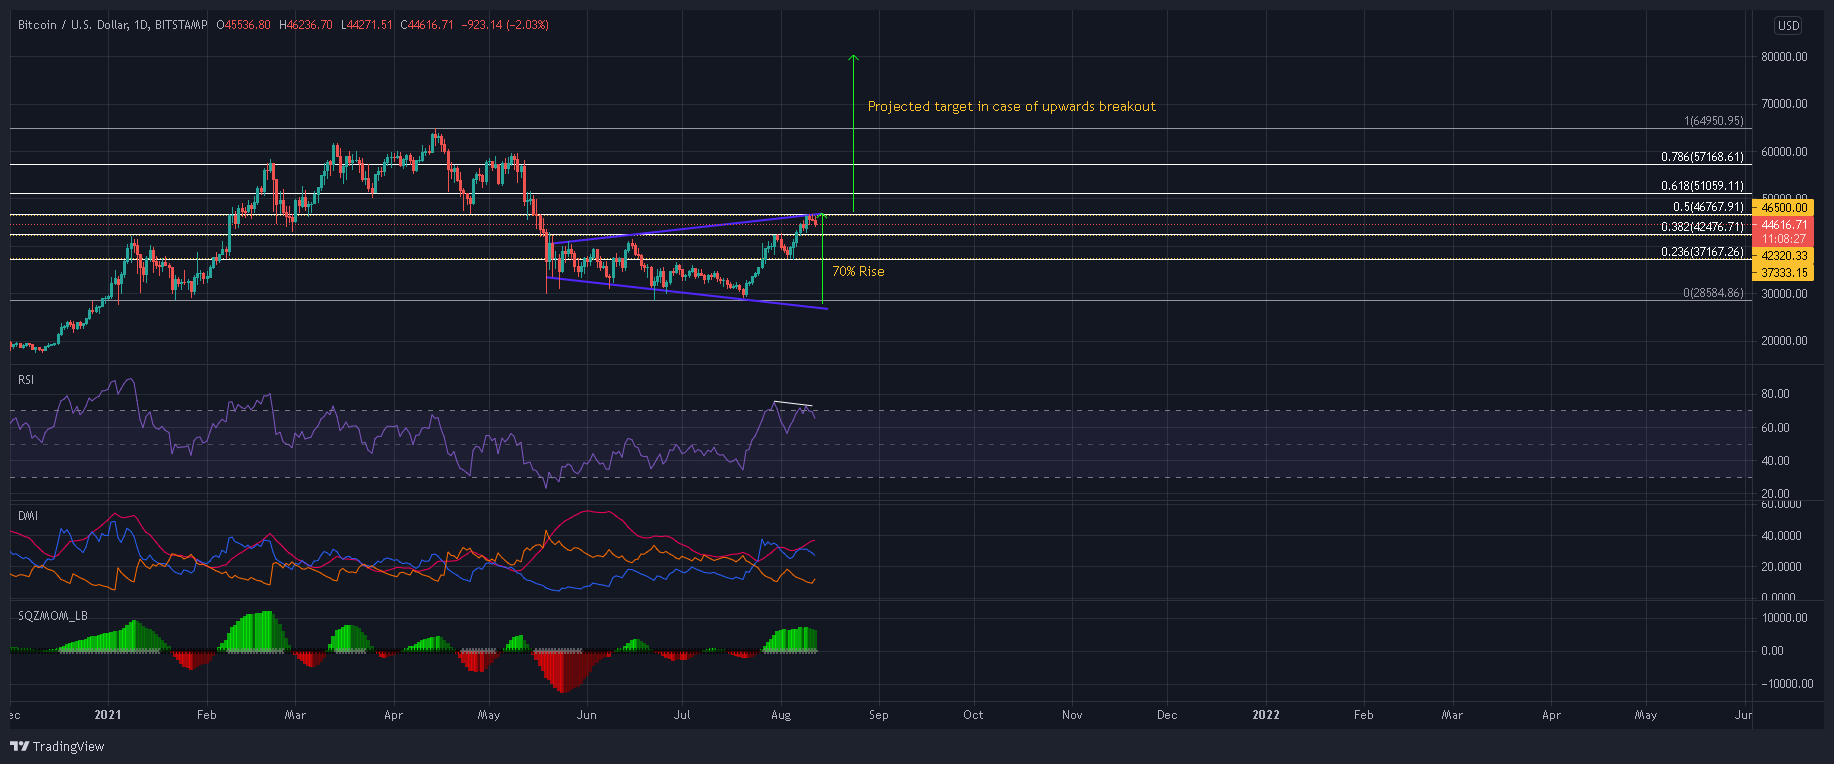
Isolating BTC’s movement since the sharp retracement also highlighted a broadening wedge pattern formed by higher highs and higher lows. The highest ($46,660) and lowest point ($28,600) of the pattern showed a range of 70%, which also presented the maximum upside for Bitcoin in case of an upwards breakout.
In such a scenario, BTC would form a new peak around the $80,000-mark. Until that target is achieved, traders ought to keep a close eye on the Fibonacci levels for potential support and resistance areas. Keep in mind that this outcome would only be valid if the current pattern functions as a reversal pattern, since it emerged on the back of BTC’s mid-May plummet. To negate this thesis, BTC would need to drop below the $28,000 price level.
Reasoning
The Relative Strength Index formed two lower peaks and indicated a slight bearish divergence with respect to BTC’s price action. The Squeeze Momentum Indicator also noted a slight decline over the past few days as buyers took a breather post BTC’s explosive move.
DMI lines also contracted and suggested that an uptrend was easing in the market. These signs suggested that before making any further upswings, BTC was up for a correctional phase. Once this is overturned, BTC will likely return back to its bullish narrative.
Conclusion
Bitcoin’s uptrend noted a slight halt but consolidation was healthy in the long term. Calculating its highs and lows within a broadening wedge projected an upside of another 70% from the upper trend of the pattern, which would push BTC to the $80,000 level. Such an outcome can be expected in the coming months as opposed to an immediate rally.