
Chainlink (LINK) recently got some traction as it shared a few new interesting developments on its network, each of which looked promising. For instance, the network revealed that it crossed $6.18+ trillion in transaction value enabled in 2022. Moreover, according to the same, Chainlink exceeded 4.2 billion data points delivered on-chain.
1/ In Q3 2022, the #Chainlink ecosystem expanded to 1500+ projects across 15 #blockchains.
Key milestones:
? $6.18+ trillion transaction value enabled in 2022
? 4.2B+ data points delivered on-chain
? 8M+ randomness requests served
?️ 15K+ GitHub repos using Chainlink pic.twitter.com/4KP3ORopPr— Chainlink (@chainlink) October 1, 2022
However, these developments could not make an impact on LINK’s price chart as it was trading over 4% lower than last week at $7.51 with a market capitalization of over $3.68 billion. Interestingly, a look at LINK’s on-chain metrics also painted a somewhat negative picture of the coin, as several of them were suggesting a downtrend soon.
What’s cooking really?
Santiment’s data revealed that things might not be all good for LINK in the coming days.
LINK’s volume registered a massive downfall lately after spiking on 29 September. LINK’s development activity has also fallen over the last few days, which by and large is a red flag for any blockchain. Not only that, but LINK’s social volume followed the same route and depreciated, compared to last week – Not a positive sign as it indicates reduced interest in the coin.
However, soon after the same, LINK’s MVRV Ratio registered an uptick. This might just help the coin appreciate in value on the charts.
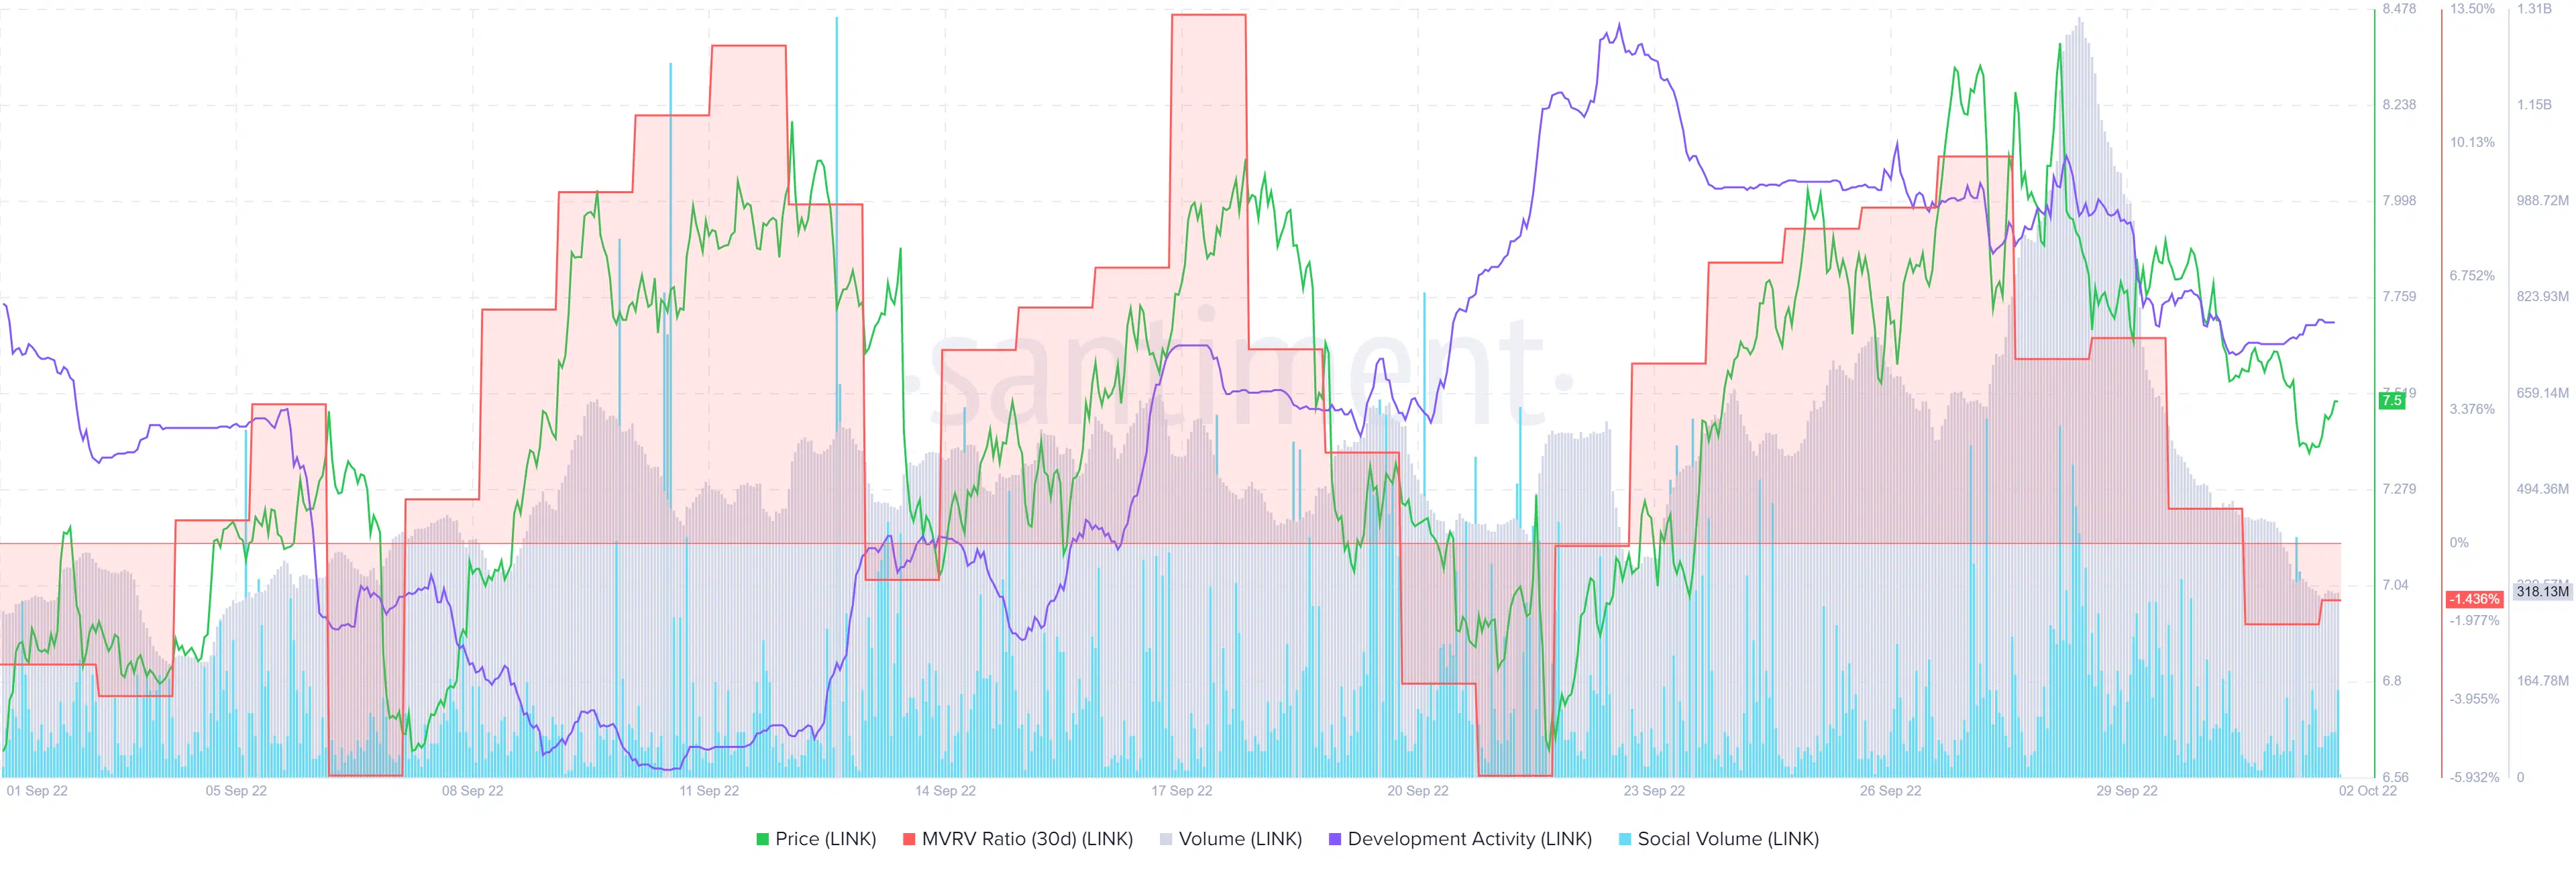
Source: Santiment
The brighter side?
Interestingly, CryptoQuant’s data revealed that LINK’s exchange reserve noted a downfall – A bullish signal as it seemed to point to low selling pressure. The same was true for LINK’s exchange netflows too as it was low, compared to the 7-day average – Yet another green flag for the coin.
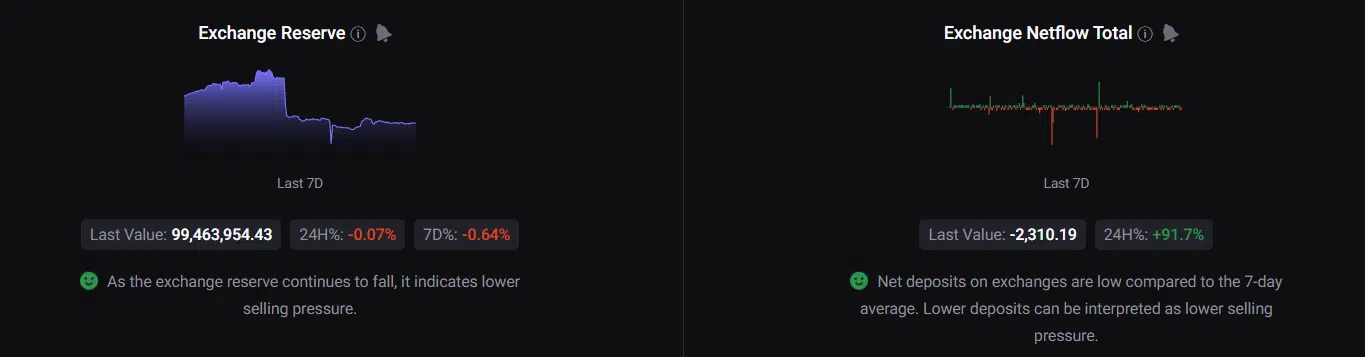
Source: CryptoQuant
However, LINK’s daily chart projected an ambiguous picture as a few market indicators suggested better days to come and the others pointed to a downfall. For instance, LINK’s 20-day Exponential Moving Average (EMA) was above the 55-day EMA. This suggested buyers’ advantage in the market.
The Bollinger Bands revealed that LINK’s price was in a crunched zone and might soon get volatile. Nonetheless, the MACD revealed that after a tussle, the bears gained an advantage as a bearish crossover was registered.
Moreover, the Relative Strength Index (RSI) and Chaikin Money Flow (CMF) were at neutral positions, suggesting that the market could head in any direction in the coming days.