Toncoin bulls face tough battle – Is $3.6 just a dead cat bounce?
The high trading volume alongside the 25% price bounce in four days indicated short-term bullishness.

- Toncoin maintained a bearish daily market structure.
- The high volume on the recent bounce gave some hope to TON bulls.
Toncoin [TON] holders were not doing well for the most part. Data showed that 96% of holders were underwater, but the token saw a 25% price bounce in the past four days.
Yet, the severity of the downtrend on the daily chart was uninterrupted.
How high could the current bounce go? The $3.85 resistance level was one of the leading candidates for a bearish reversal.
AMBCrypto examined the relevant liquidation heatmaps to understand TON’s potential price moves.
Toncoin to climb to $3.6 before bearish reversal

The recent lower high at $3.95 from February was a potential price target for TON in the coming days. The MACD remained below zero but formed a strong bullish crossover.
It was in response to the quick gains in recent gains, but the prevalent trend in this timeframe remained bearish.
However, the high trading volume in recent days saw the OBV jump above the lows from December. In doing so, it sparked some hope for a bullish move.
The Fibonacci retracement levels were plotted based on the rally from February to June 2024. The bounce above 78.6% was encouraging in the short term, but there was resistance overhead.
The $3.95 target must be breached to effect a bullish market structure shift.
Even if this occurred, the $4.5 zone would likely act as a supply zone. Overall, the chances of a quick TON recovery were slim.
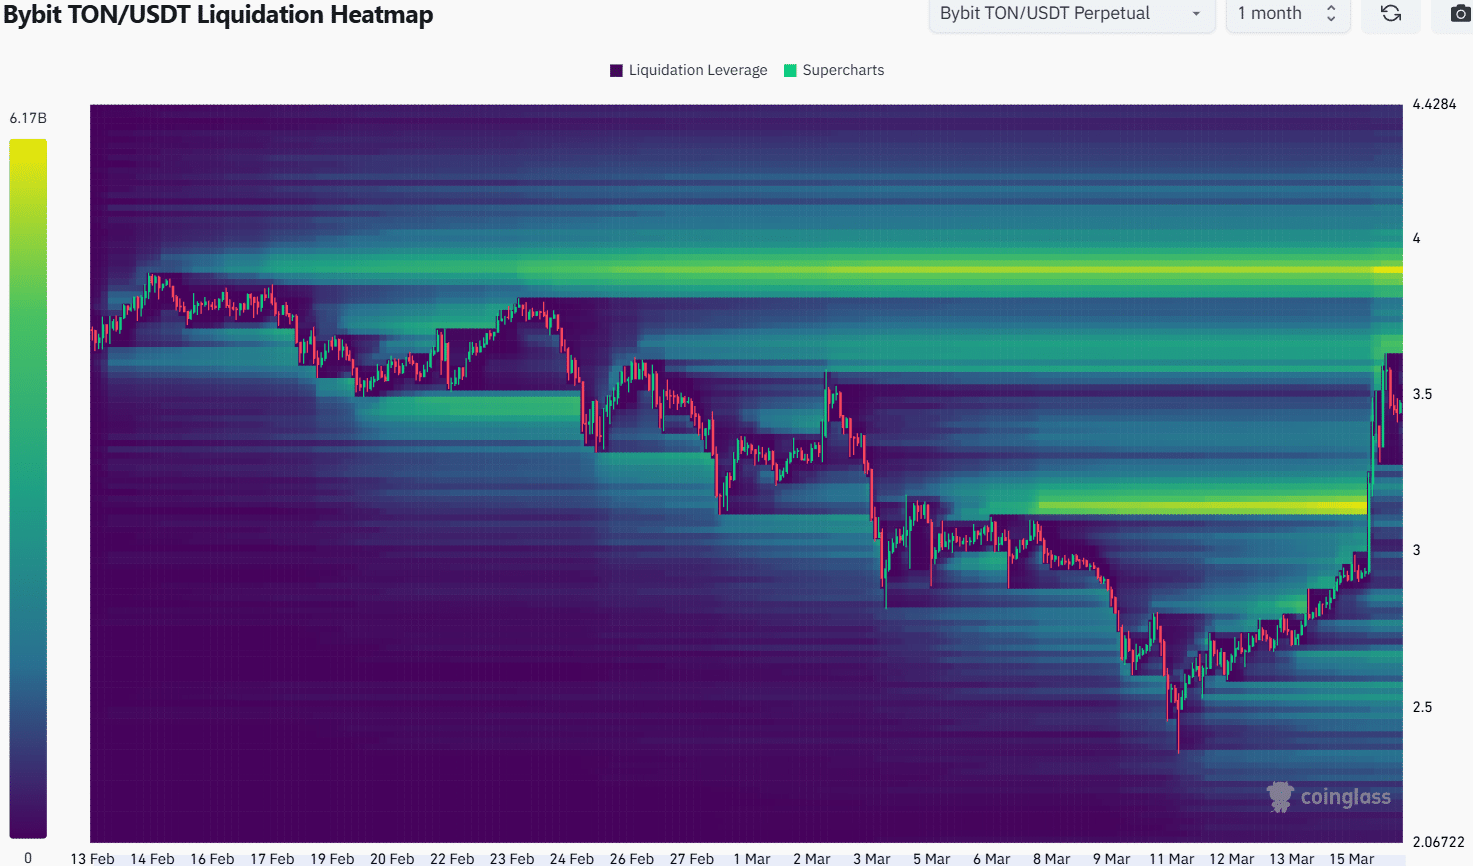
The 1-month liquidation heatmap highlighted the liquidity pockets at $3.66 and $3.9. The former level was just above the highs were Saturday, and the latter marked the lower high formed a month ago.
Together, these two levels were the prime candidates for a bearish reversal to begin at.
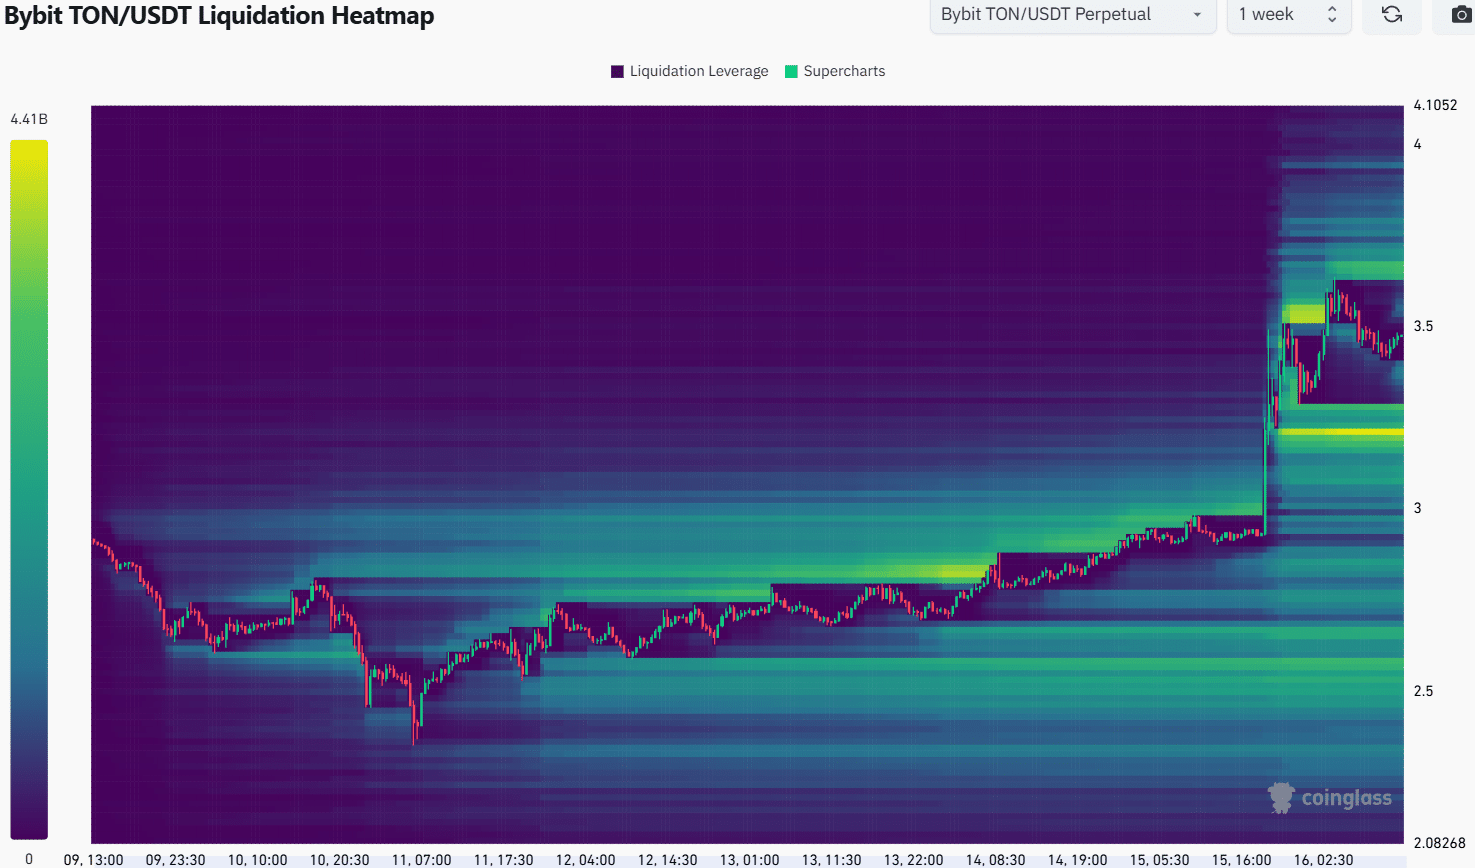
Zooming into the 1-week heatmap, we can see that the $3.2 and $3.67 levels were the ones to watch out for. The liquidity around $3.2 was comparable to that around $3.6.
Since $3.6 was closer, TON was more likely to climb higher to sweep the liquidity before falling to $3.2.
Swing traders can wait for such a move and then look for a reversal in the lower timeframes, targeting a retracement of the move. Usually, such strong reversals have a good chance to occur on Monday.
A move beyond $3.7 would invalidate the idea of a retracement to $3.2 in search of liquidity.
Disclaimer: The information presented does not constitute financial, investment, trading, or other types of advice and is solely the writer’s opinion