Toncoin: Can TON extend its 20% surge and break past $7?

- The momentum of Toncoin remained bullish but has weakened compared to the previous week.
- Sustained demand was seen in recent weeks, but it might not be enough to break the $7.3 and $8.3 resistance zones.
Toncoin [TON] was up nearly 20% after the swift drop to $5.3 on Monday the 9th of December. This dip varied across exchanges, reaching $5.3 on Binance but $4.91 on Bybit. Liquidation cascade’s bottom aside, the recovery has been remarkable on the lower timeframes.
Bitcoin [BTC] has yet to convert the $101k-$103k zone for support. However, the altcoin market cap has been in a strong uptrend since November. After the large reset on Monday, further gains can be expected.
Toncoin finds support around the $5 demand zone
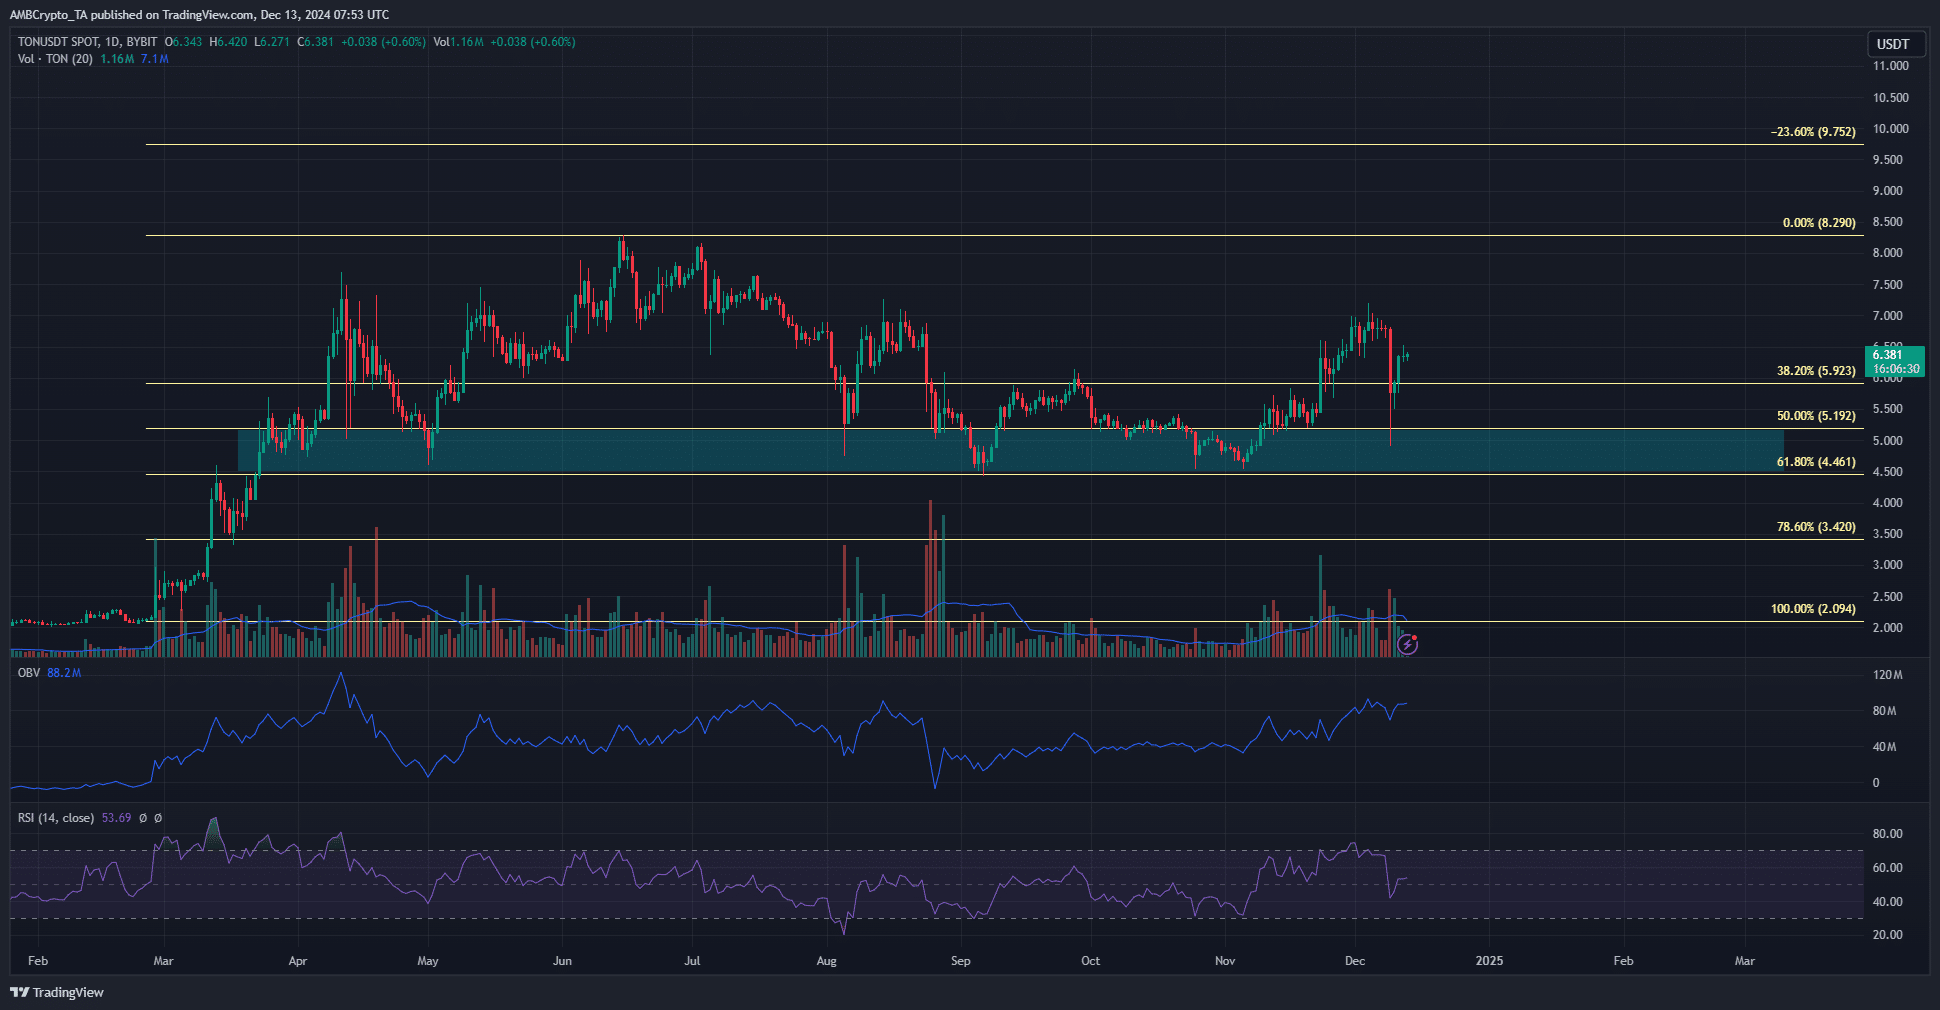
The $5.9 level, which served as resistance in September and November, has been flipped to support. The volatility on Monday threatened to break it, but the bulls have recovered since then.
This was reflected by the OBV’s uptrend over the past month. Although substantial selling was present earlier this week, the uptrend remained uninterrupted.
A concern for TON bulls was the performance over the past 12–14 weeks. While the $4.5-$5 demand zone has been stoutly defended, the $6.9-$7.1 resistance zone has not been breached. Heavier demand for Toncoin would be necessary to push the asset on a long-term uptrend and toward new all-time highs.
On the daily chart, the RSI was at 53. The momentum has slowed down from where it was a week ago but remained on the bullish side.
Short-term rally targeting $7 in sight

Source: Coinglass
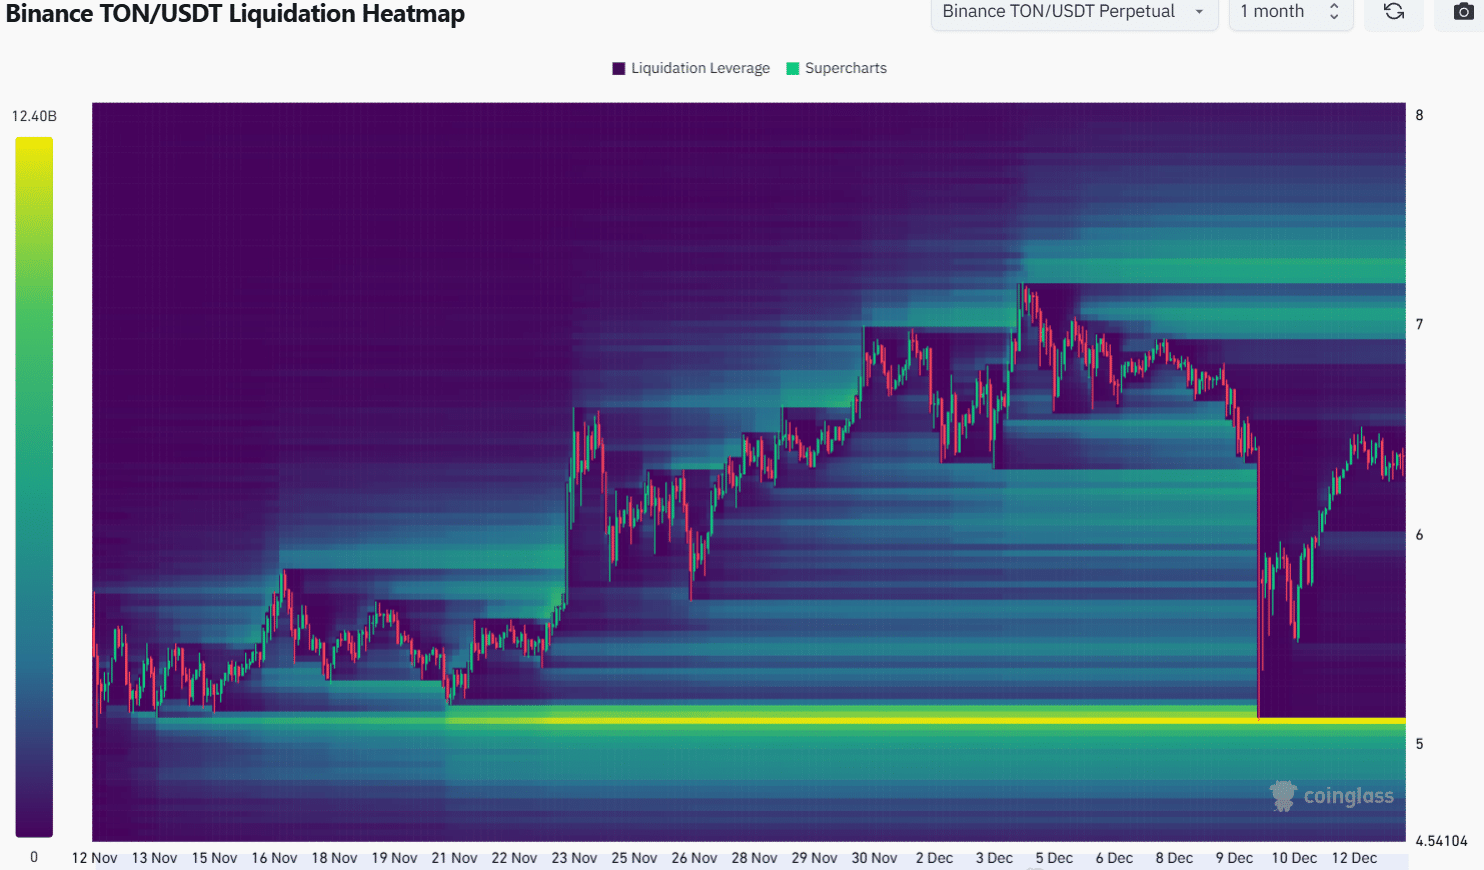
The past month’s liquidation heatmap highlighted the high concentration of liquidation levels around $5.05-$5.15. It was tested on Monday and the prices have since rebounded. The liquidity pocket around $5 was still present.
A Bitcoin price drop below $98.6k could feed any short-term bearish sentiment in the market and could drive TON lower as well.
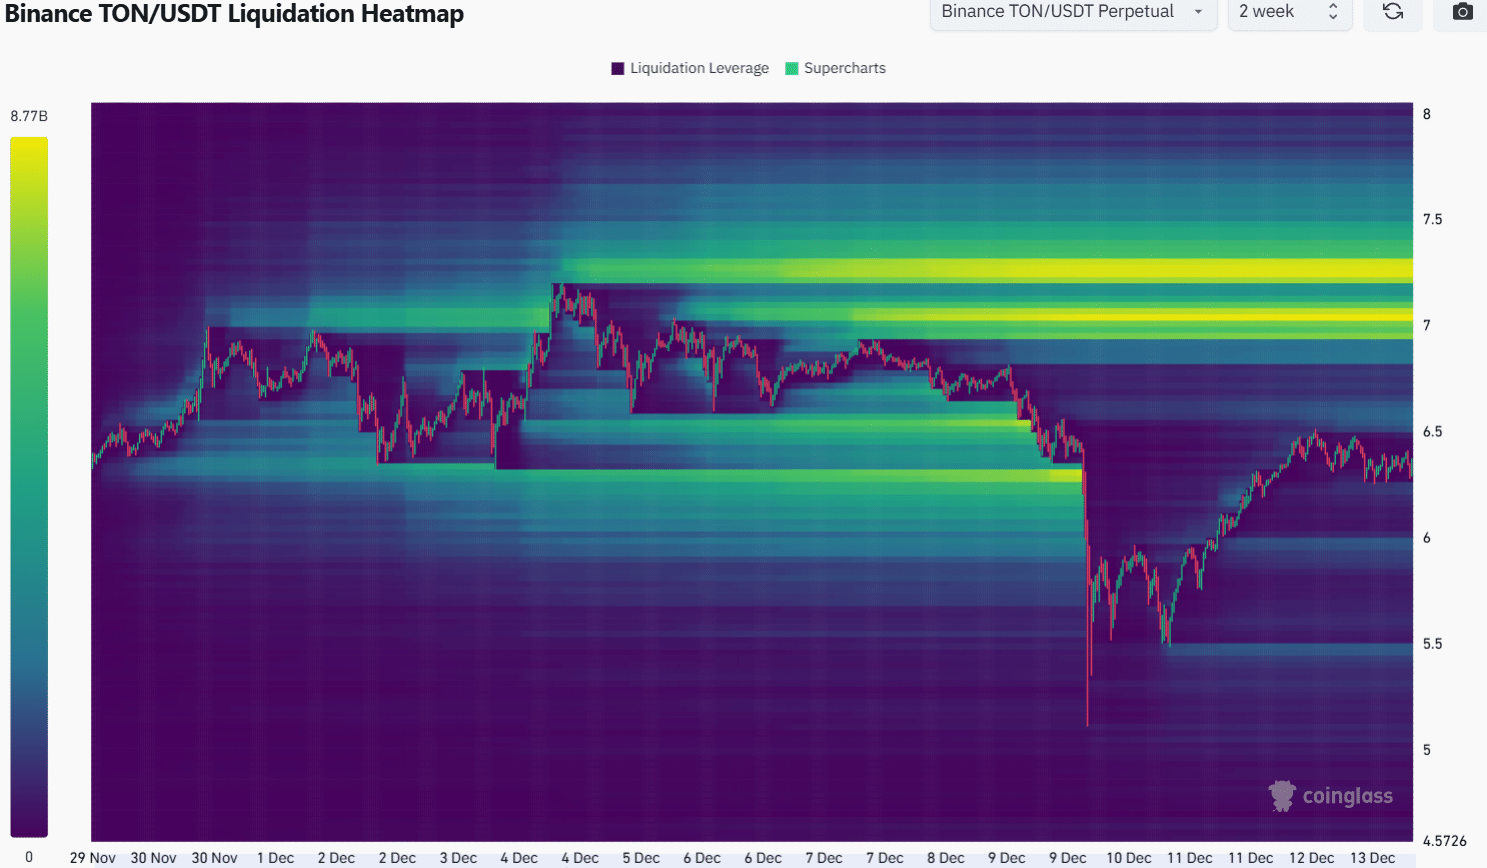
As things stand, the drop to $5 appeared unlikely. This was because of the presence of a pocket of liquidity around $7, which was closer to current market prices. The 2-week liquidation heatmap highlighted the $7.05 and $7.3 regions as short-term bullish price targets.
Is your portfolio green? Check the Toncoin Profit Calculator
Whether the Toncoin bulls will succeed in breaking past this resistance zone remains to be seen, but the short-term TON price prediction is bullish.
Disclaimer: The information presented does not constitute financial, investment, trading, or other types of advice and is solely the writer’s opinion


