


Toncoin [TON] climbed 13.36% over the last 24 hours and reached $1.70 at press time. This extended its recovery from recent lows even as broader market participation remained subdued.
However, spot volume declined 16.51% to $250.8 million despite the strong price advance. This divergence suggested buyers pushed prices higher without broad market participation supporting the move.
Recent sessions had already shown TON recovering from local lows, helping the asset regain strength after a prolonged decline. Even with the sharp rebound, weakening volume indicated that trading activity had not kept pace with the rally.
Why were TON’s futures traders still selling?
Derivatives data painted a different picture from the spot market.
Futures Taker CVD remained seller-dominant throughout the rally, indicating aggressive market sellers continued to outweigh aggressive buyers. Despite TON gaining more than 13%, futures participants had not fully embraced the move.
The divergence suggested part of the advance may have resulted from passive buying activity or short-covering rather than sustained derivatives demand.
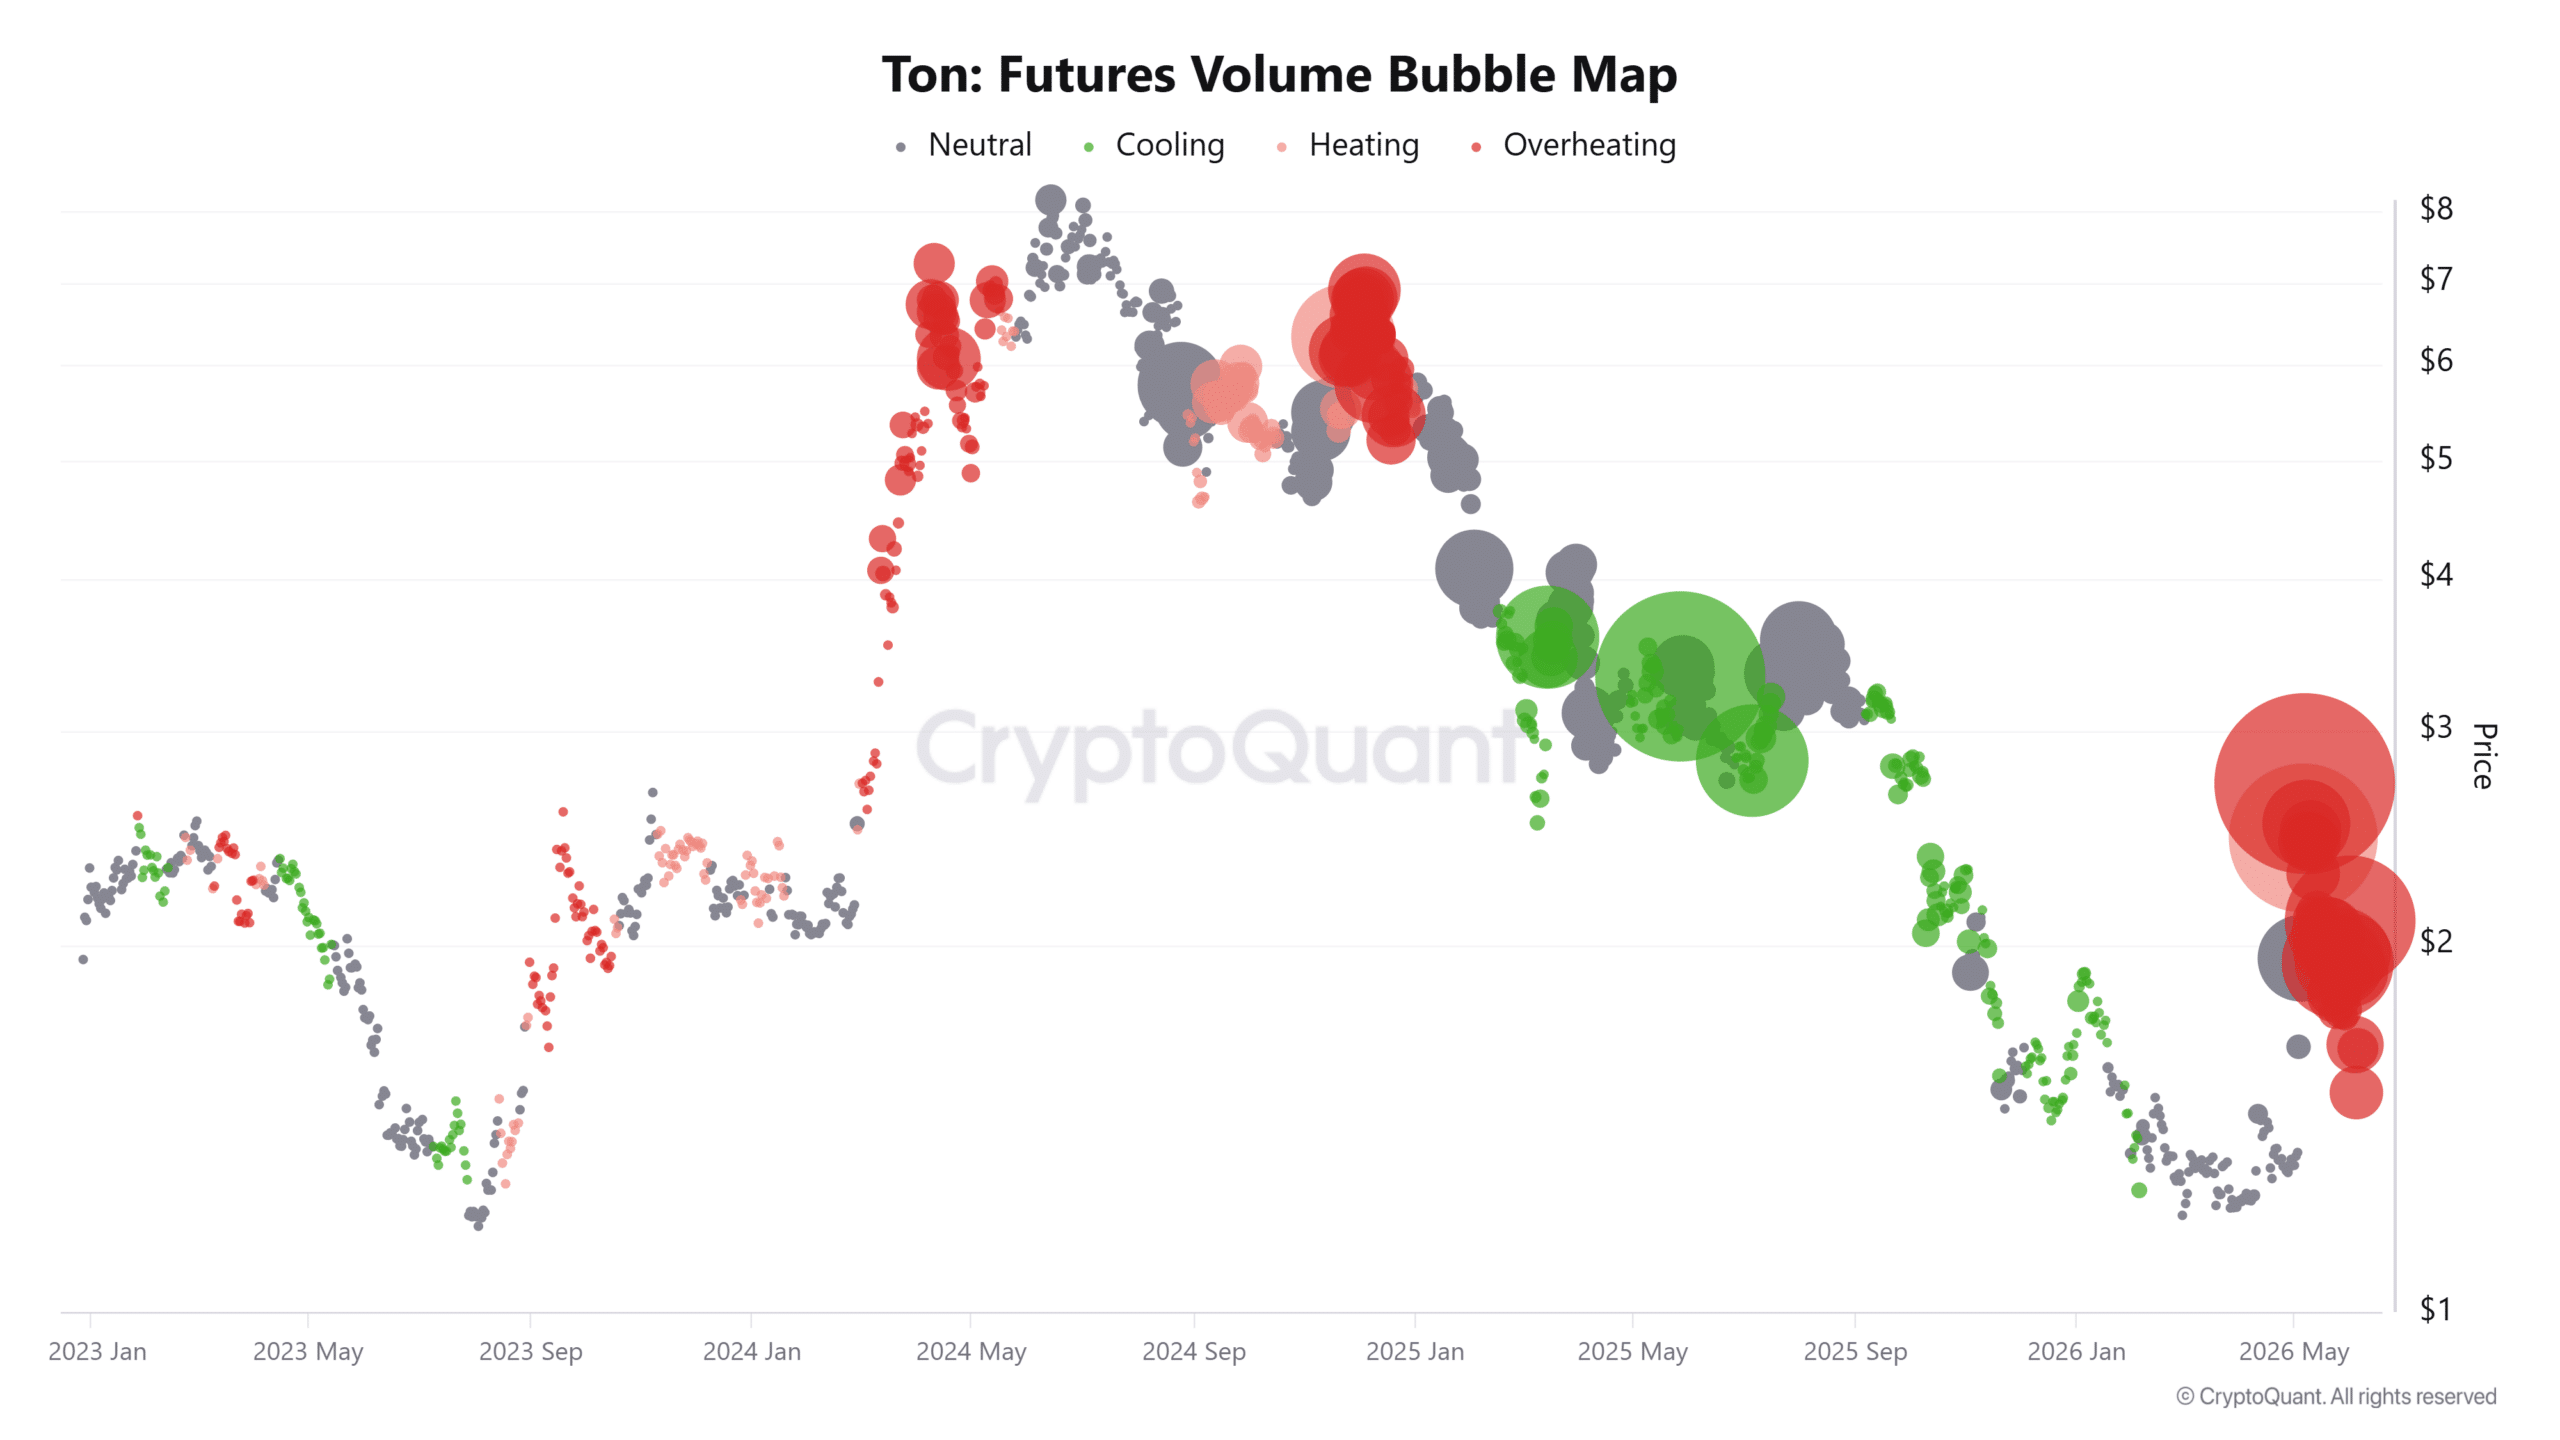
In addition, the Futures Volume Bubble Map entered an overheating zone, highlighting elevated speculative activity across the market. Such conditions have historically increased volatility when traders become crowded on one side.
Therefore, TON’s rally unfolded while futures traders largely maintained a cautious stance instead of aggressively chasing higher prices.
Can TON clear its next hurdle?
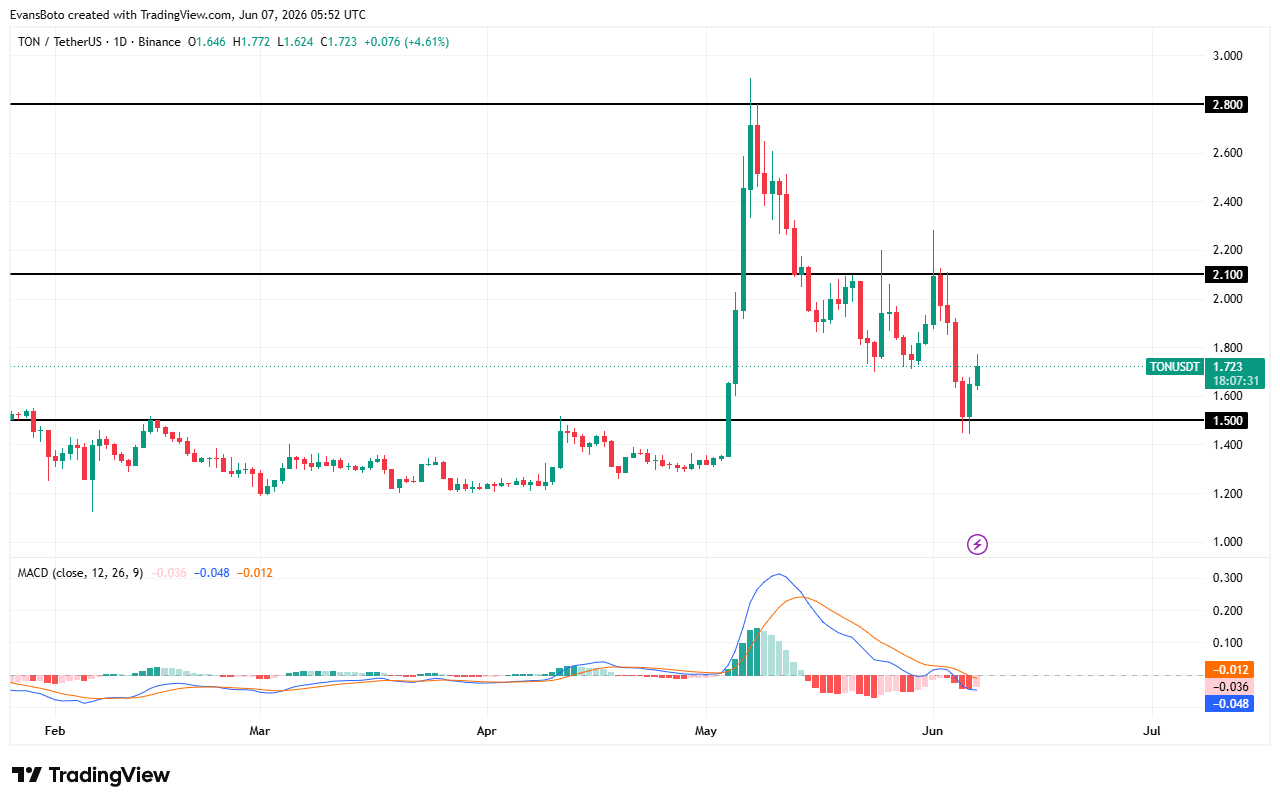
After defending the $1.50 support level, TON recovered toward $1.72 and established distance from its recent low. However, buyers had not yet reclaimed the critical $2.10 resistance zone that repeatedly capped previous advances. The broader chart structure still showed resistance at $2.10, with a higher barrier positioned near $2.80.
Technical indicators also reflected mixed conditions. At the time of writing, the MACD line remained below the signal line, while the histogram stayed negative despite showing signs of contraction. This combination suggested bearish pressure weakened but had not fully disappeared.
Although buyers regained control near support, confirmation of a broader trend reversal had not emerged. If recovery conditions continue improving, TON would likely challenge the $2.10 resistance level before targeting higher levels.
Liquidity clusters point toward higher targets
Liquidation data highlighted several important zones above the current market price.
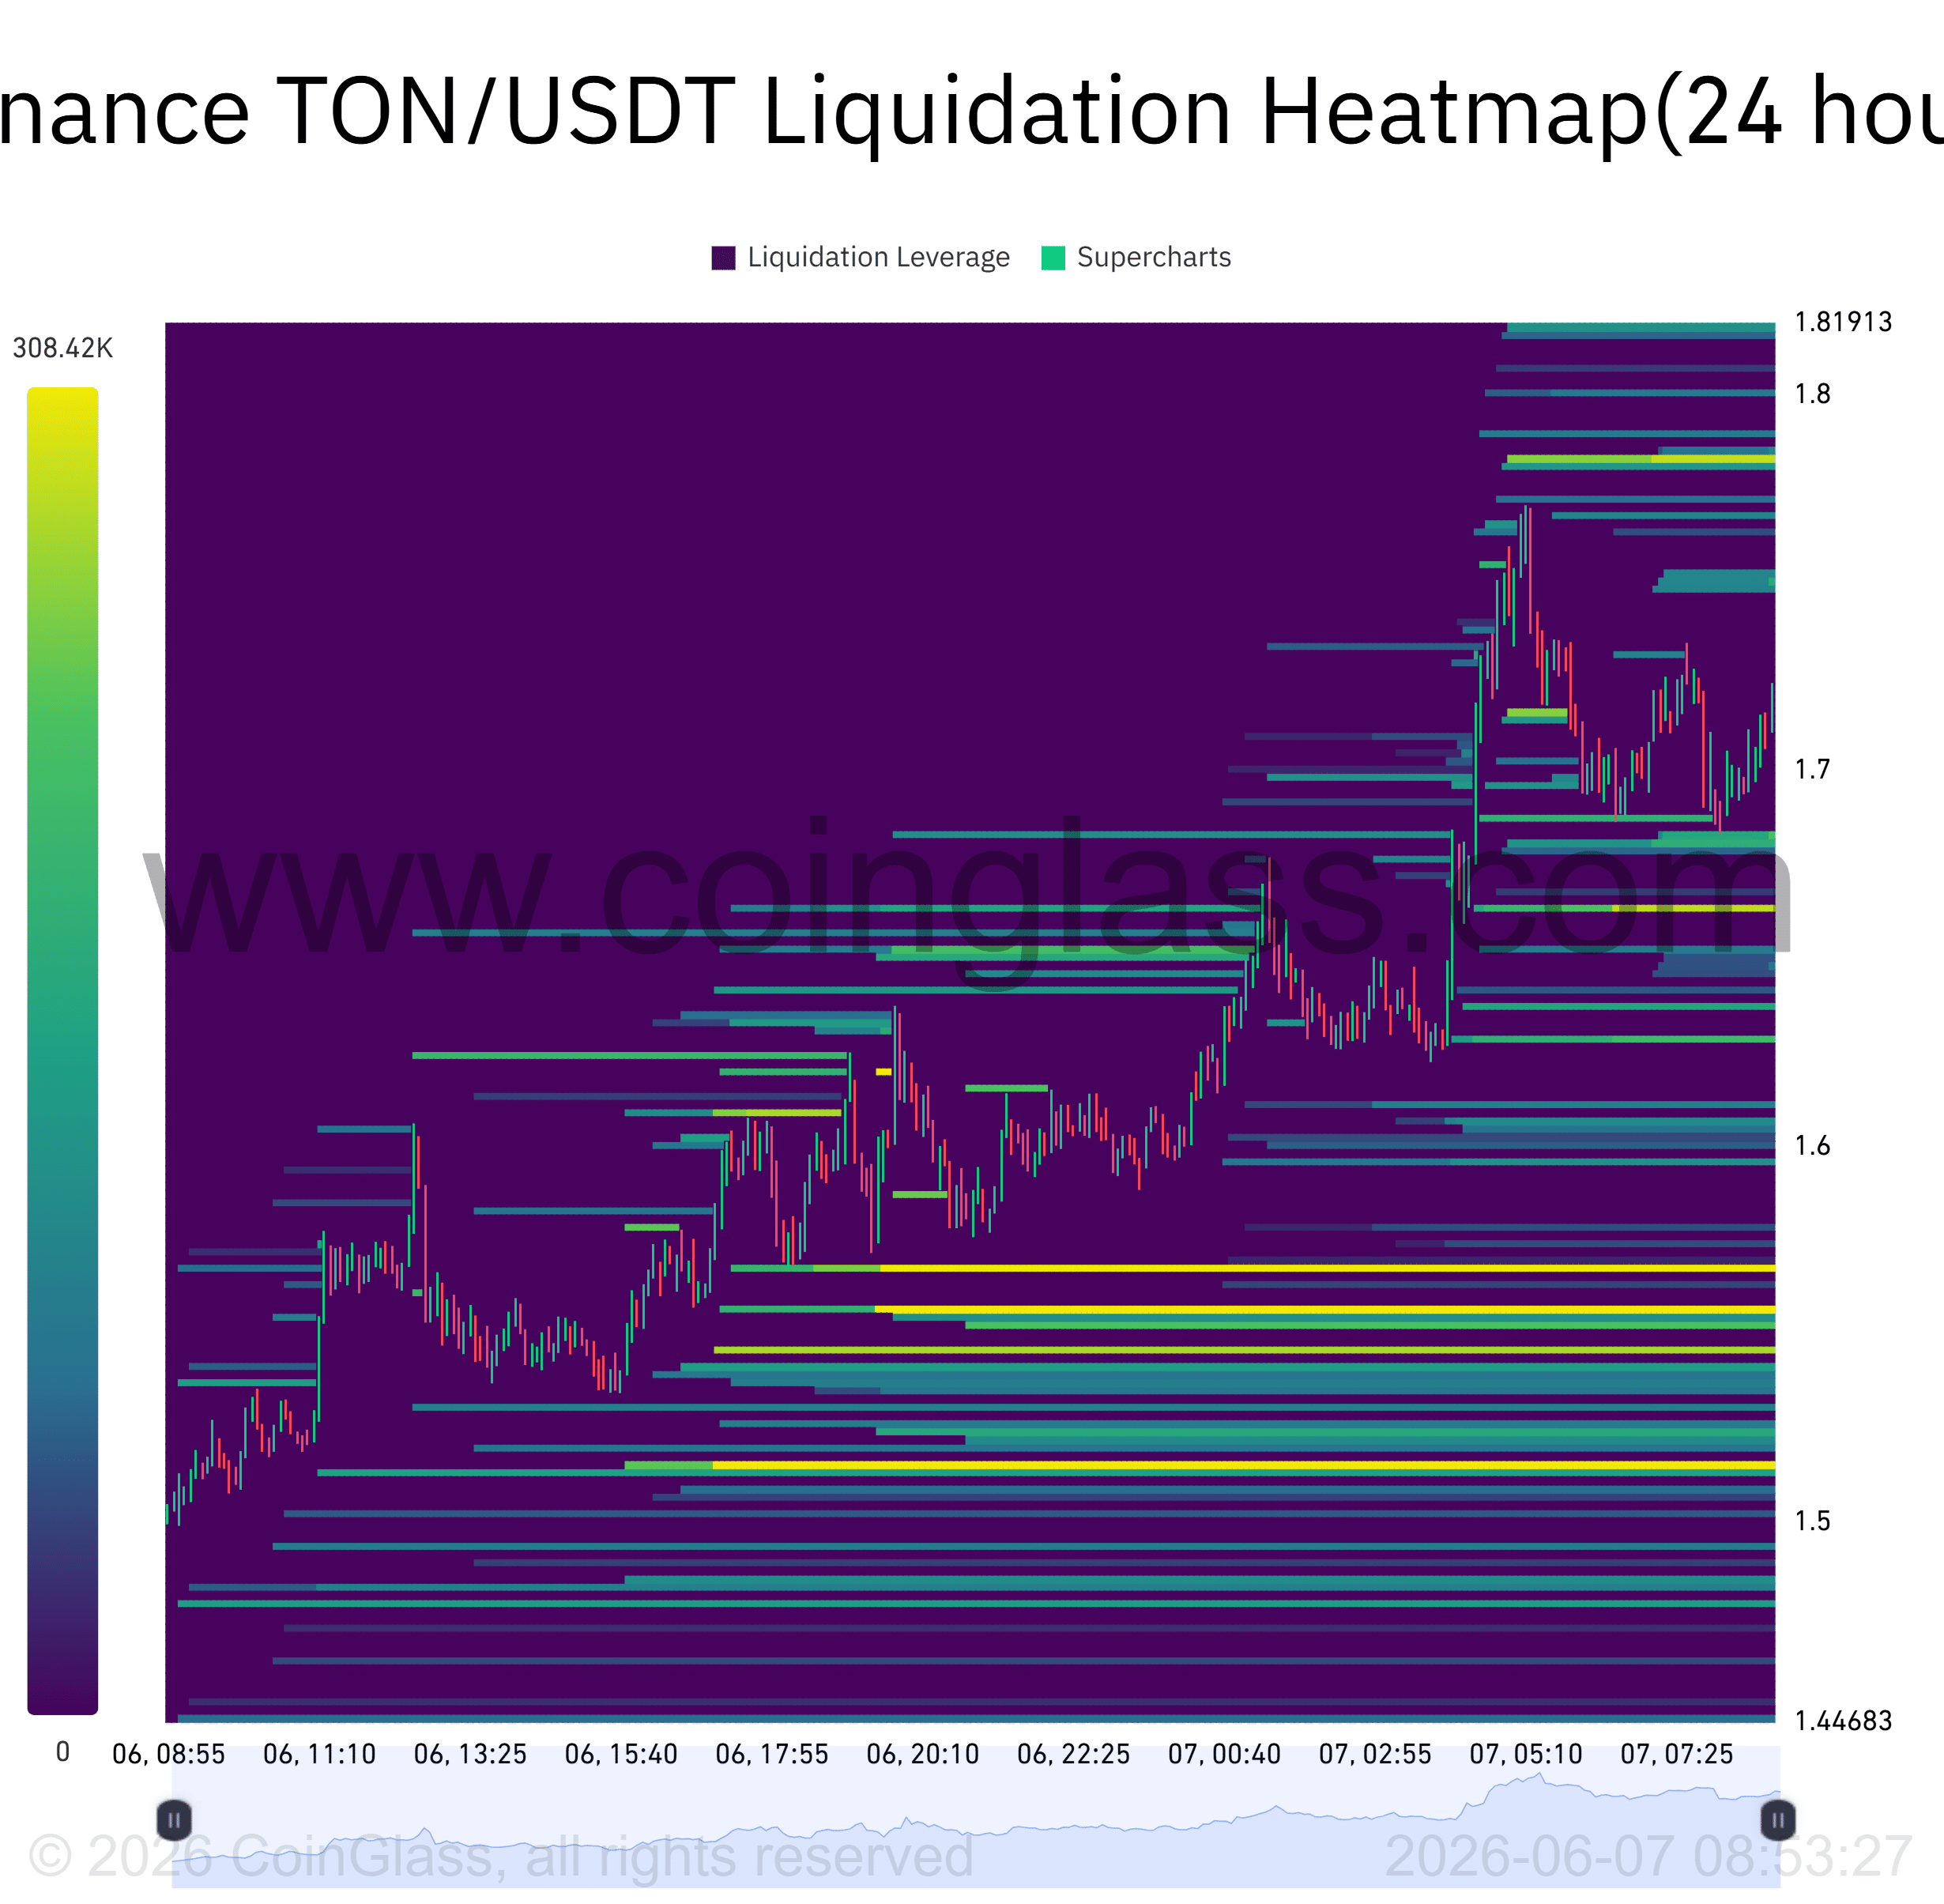
The heatmap showed dense liquidity clusters concentrated between $1.78 and $1.82, with additional pockets extending toward $1.85 and $1.90. These levels represented areas where short positions could face pressure if the price continued rising.
Markets frequently gravitate toward such liquidity concentrations because leveraged positions accumulate around them. Beneath the market, notable liquidity rested between $1.55 and $1.60, creating a critical support region.
Since TON already traded above those lower clusters, the path of least resistance appeared tilted toward the upper liquidity zones.
Can TON reclaim $2.10 as short liquidations build?
TON’s rebound from $1.50 improved the short-term outlook, and growing liquidity above $1.80 could continue attracting prices higher. However, falling spot volume, seller-dominant Futures Taker CVD, and a still-bearish MACD structure suggested the recovery lacked full confirmation.
If buyers maintain control and force liquidations through the upper clusters, TON could challenge the $2.10 resistance level. Failure to sustain demand, however, would likely keep the asset below that barrier and extend its consolidation phase.
Final Summary
- Toncoin’s recovery attracted fresh attention despite persistent futures’ market caution.
- Short liquidation clusters above $1.80 remained the market’s immediate focus.