Altcoin
Toncoin shows both bullish and bearish signs: What’s ahead for TON?
Toncoin shows mixed signals, with network growth and whale accumulation contrasting with declining large transactions.
- Toncoin’s network growth was up 9.03%, with whales accumulating, but large transactions showed bearish activity.
- Technical indicators, including RSI and Bollinger Bands, suggested potential volatility as volume spiked.
Toncoin [TON] has been making headlines lately, with a significant drop from its recent highs of around $8 down to now $5.51 at press time.
With a combination of bullish and bearish signals from both on-chain and technical indicators, traders are assessing whether this marks the beginning of a larger decline or if the asset could soon recover.
Is network growth enough?
Toncoin’s net network growth stood out at press time, showing a 9.03% increase. This bullish signal indicated a steady inflow of new users into the network, reflecting growing interest.
However, without significant buying pressure, this growth alone might not be enough to reverse the downward trend.
Meanwhile, concentration has risen by 0.60%, indicating that whales are accumulating. Large holders often play a stabilizing role during periods of volatility, showing confidence in the asset’s long-term potential.
The “In the Money” was neutral at 0.19%, reflecting that many holders are currently breaking even. This suggested a balanced market where traders are hesitant to make decisive moves until clearer trends emerge.
One concerning signal is the 0.37% decline in large transactions, which indicates reduced participation from major players and suggests hesitation in making major moves in the current market.
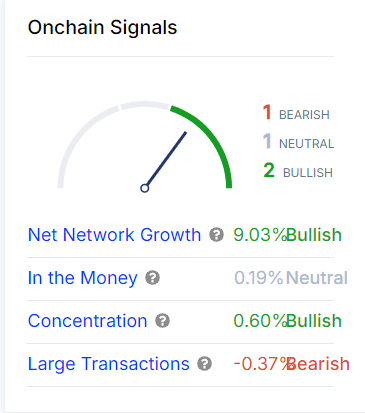
Source: IntoTheBlock
Technical indicators: RSI and Bollinger bands
From a technical analysis perspective, the relative strength index (RSI) was at 41.82, nearing oversold territory. Thus, Toncoin could be due for a short-term bounce, although it does not confirm a sustained reversal.
The Bollinger Bands (BB) showed that Toncoin was consolidating, with the price nearing the lower band at $5.43. The lower band could indicate support, with volatility likely to increase.
The upper band was at $5.60, and a breach of this level could signal upward momentum.
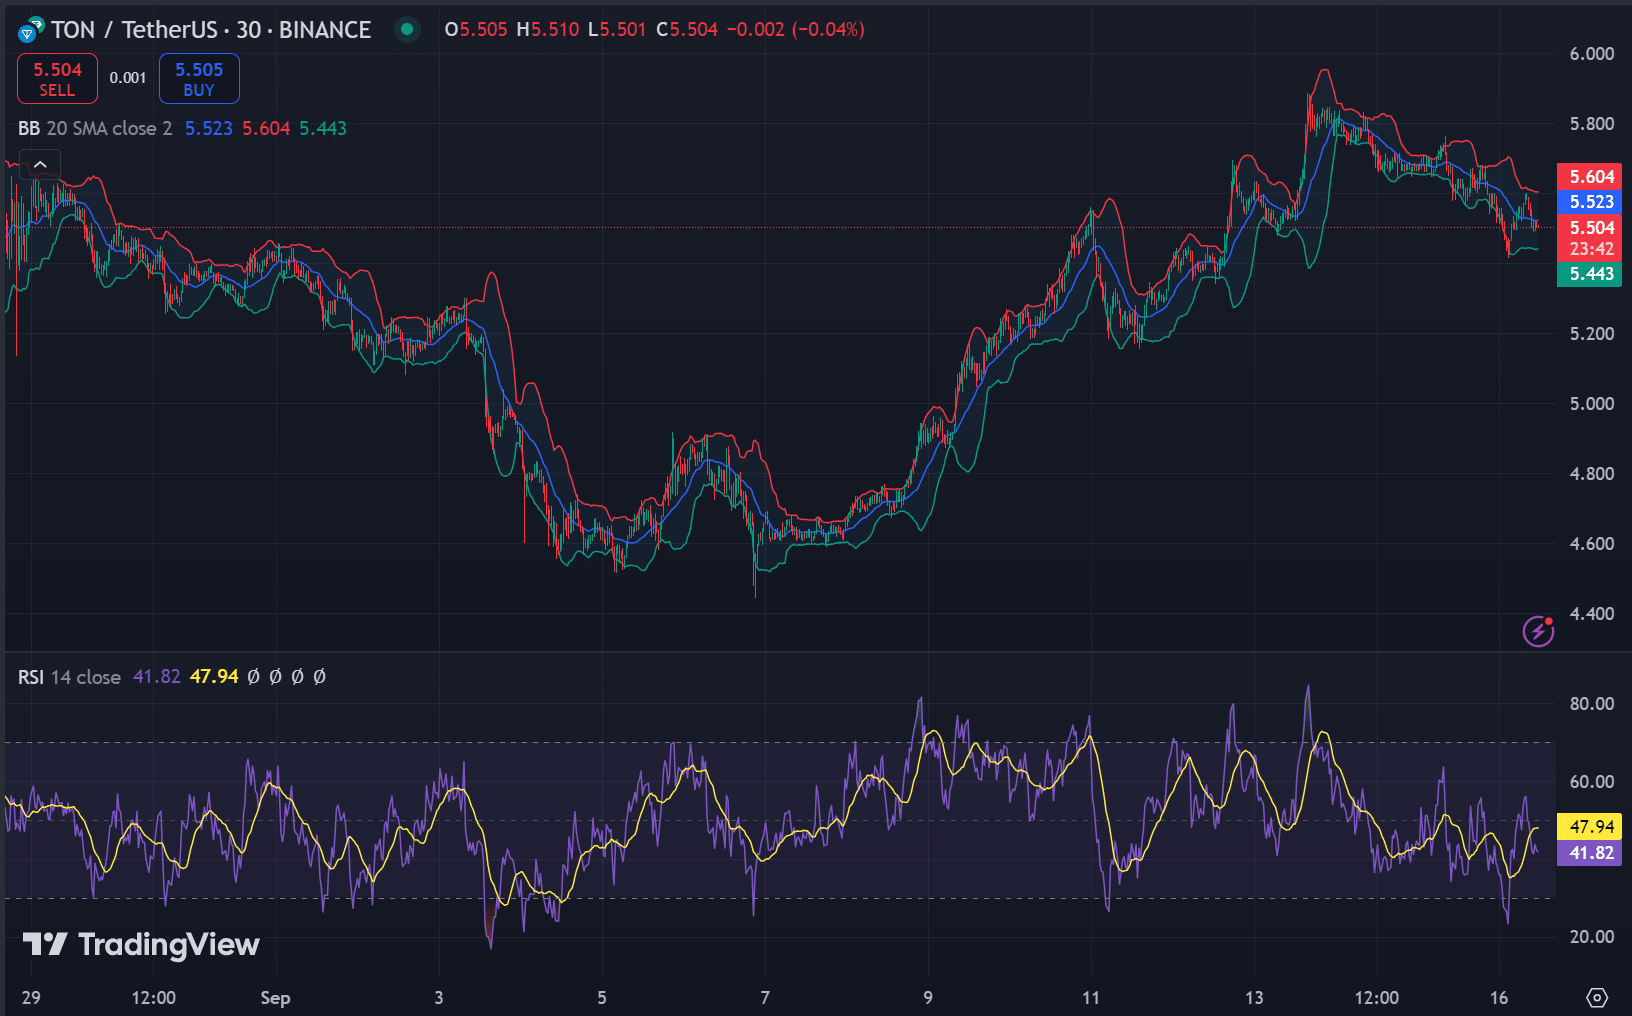
Source: TradingView
Volume spike and effects on TON
Despite the price decline, trading volume has increased by 7.92%, reaching $319.58 million, according to Coinglass data.
This uptick in volume suggested increased market activity, which could lead to significant price swings in the near future.
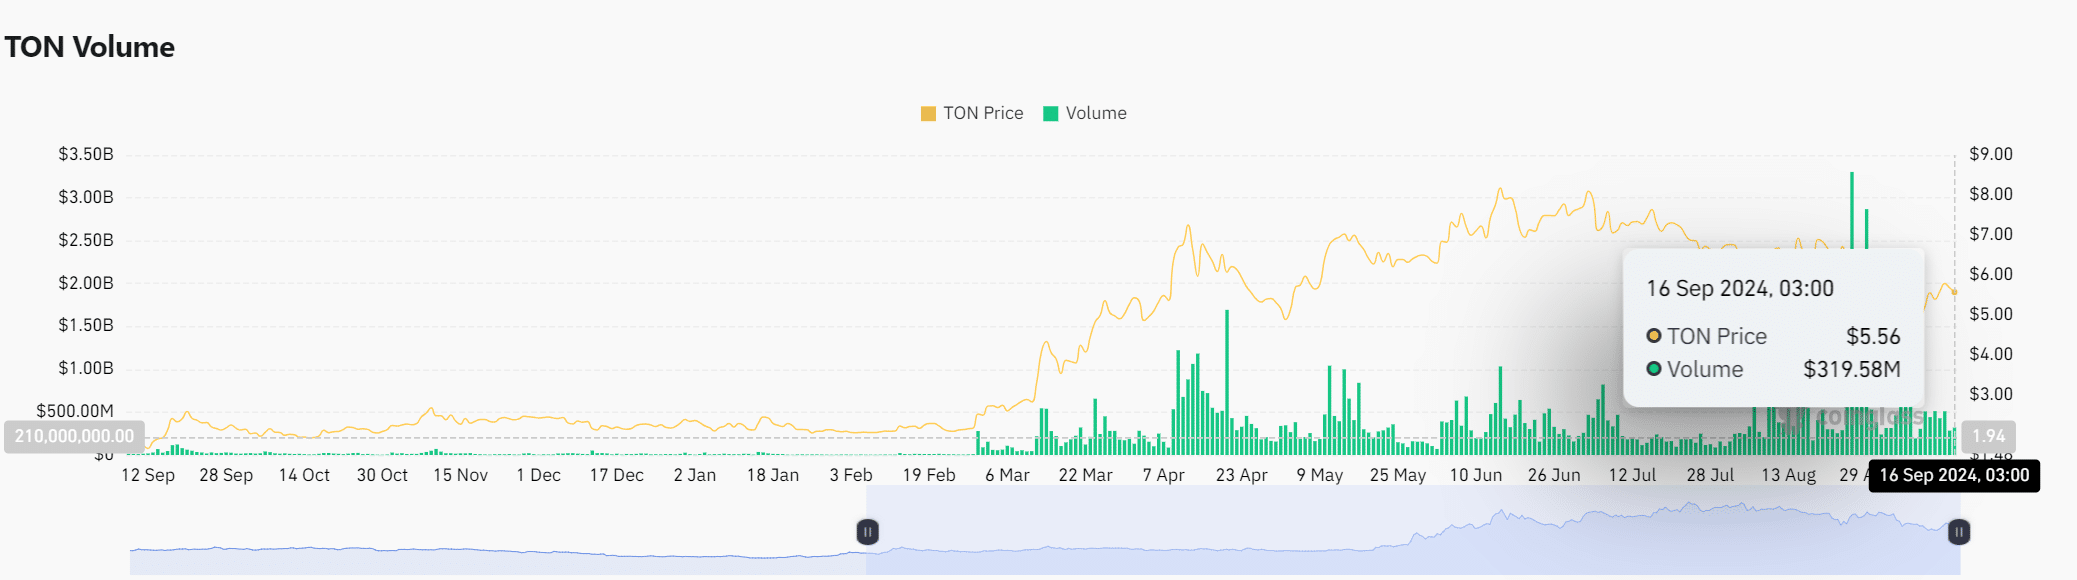
Source: Coinglass
Toncoin’s indicators provided a mixed outlook. While Network Growth and whale accumulation were positive, the decline in large transactions and a neutral “In the Money” showed caution.
Read Toncoin’s [TON] Price Prediction 2024-25
Combined with technical signals like RSI and Bollinger Bands, Toncoin looked to be at a key point.
The market’s next move could be influenced by rising volume and a potential breakout from the current consolidation phase.