Toncoin – Will another ATH follow its latest high? Metrics say…
Toncoin may rally to reclaim its all-time high if selling activity is kept at bay.

- TON rose briefly to a new all-time high on 15 June
- Bullish bias towards the altcoin appeared to be significant on the charts
In the early trading hours of 15 June, the popular cryptocurrency Toncoin [TON], linked to the messaging app Telegram, soared to a new all-time high.
According to CoinMarketCap, the altcoin’s price briefly rose above $8 to exchange hands at $8.24, before witnessing a correction. At press time, TON’s price was $7.96, down by 3% since hitting its ATH.
TON is not done climbing
An assessment of the token’s performance on the daily chart confirmed that, despite the slight uptick in selling pressure forcing TON’s price to fall from its new all-time high. In fact, the bullish bias remains significant across the crypto’s market.
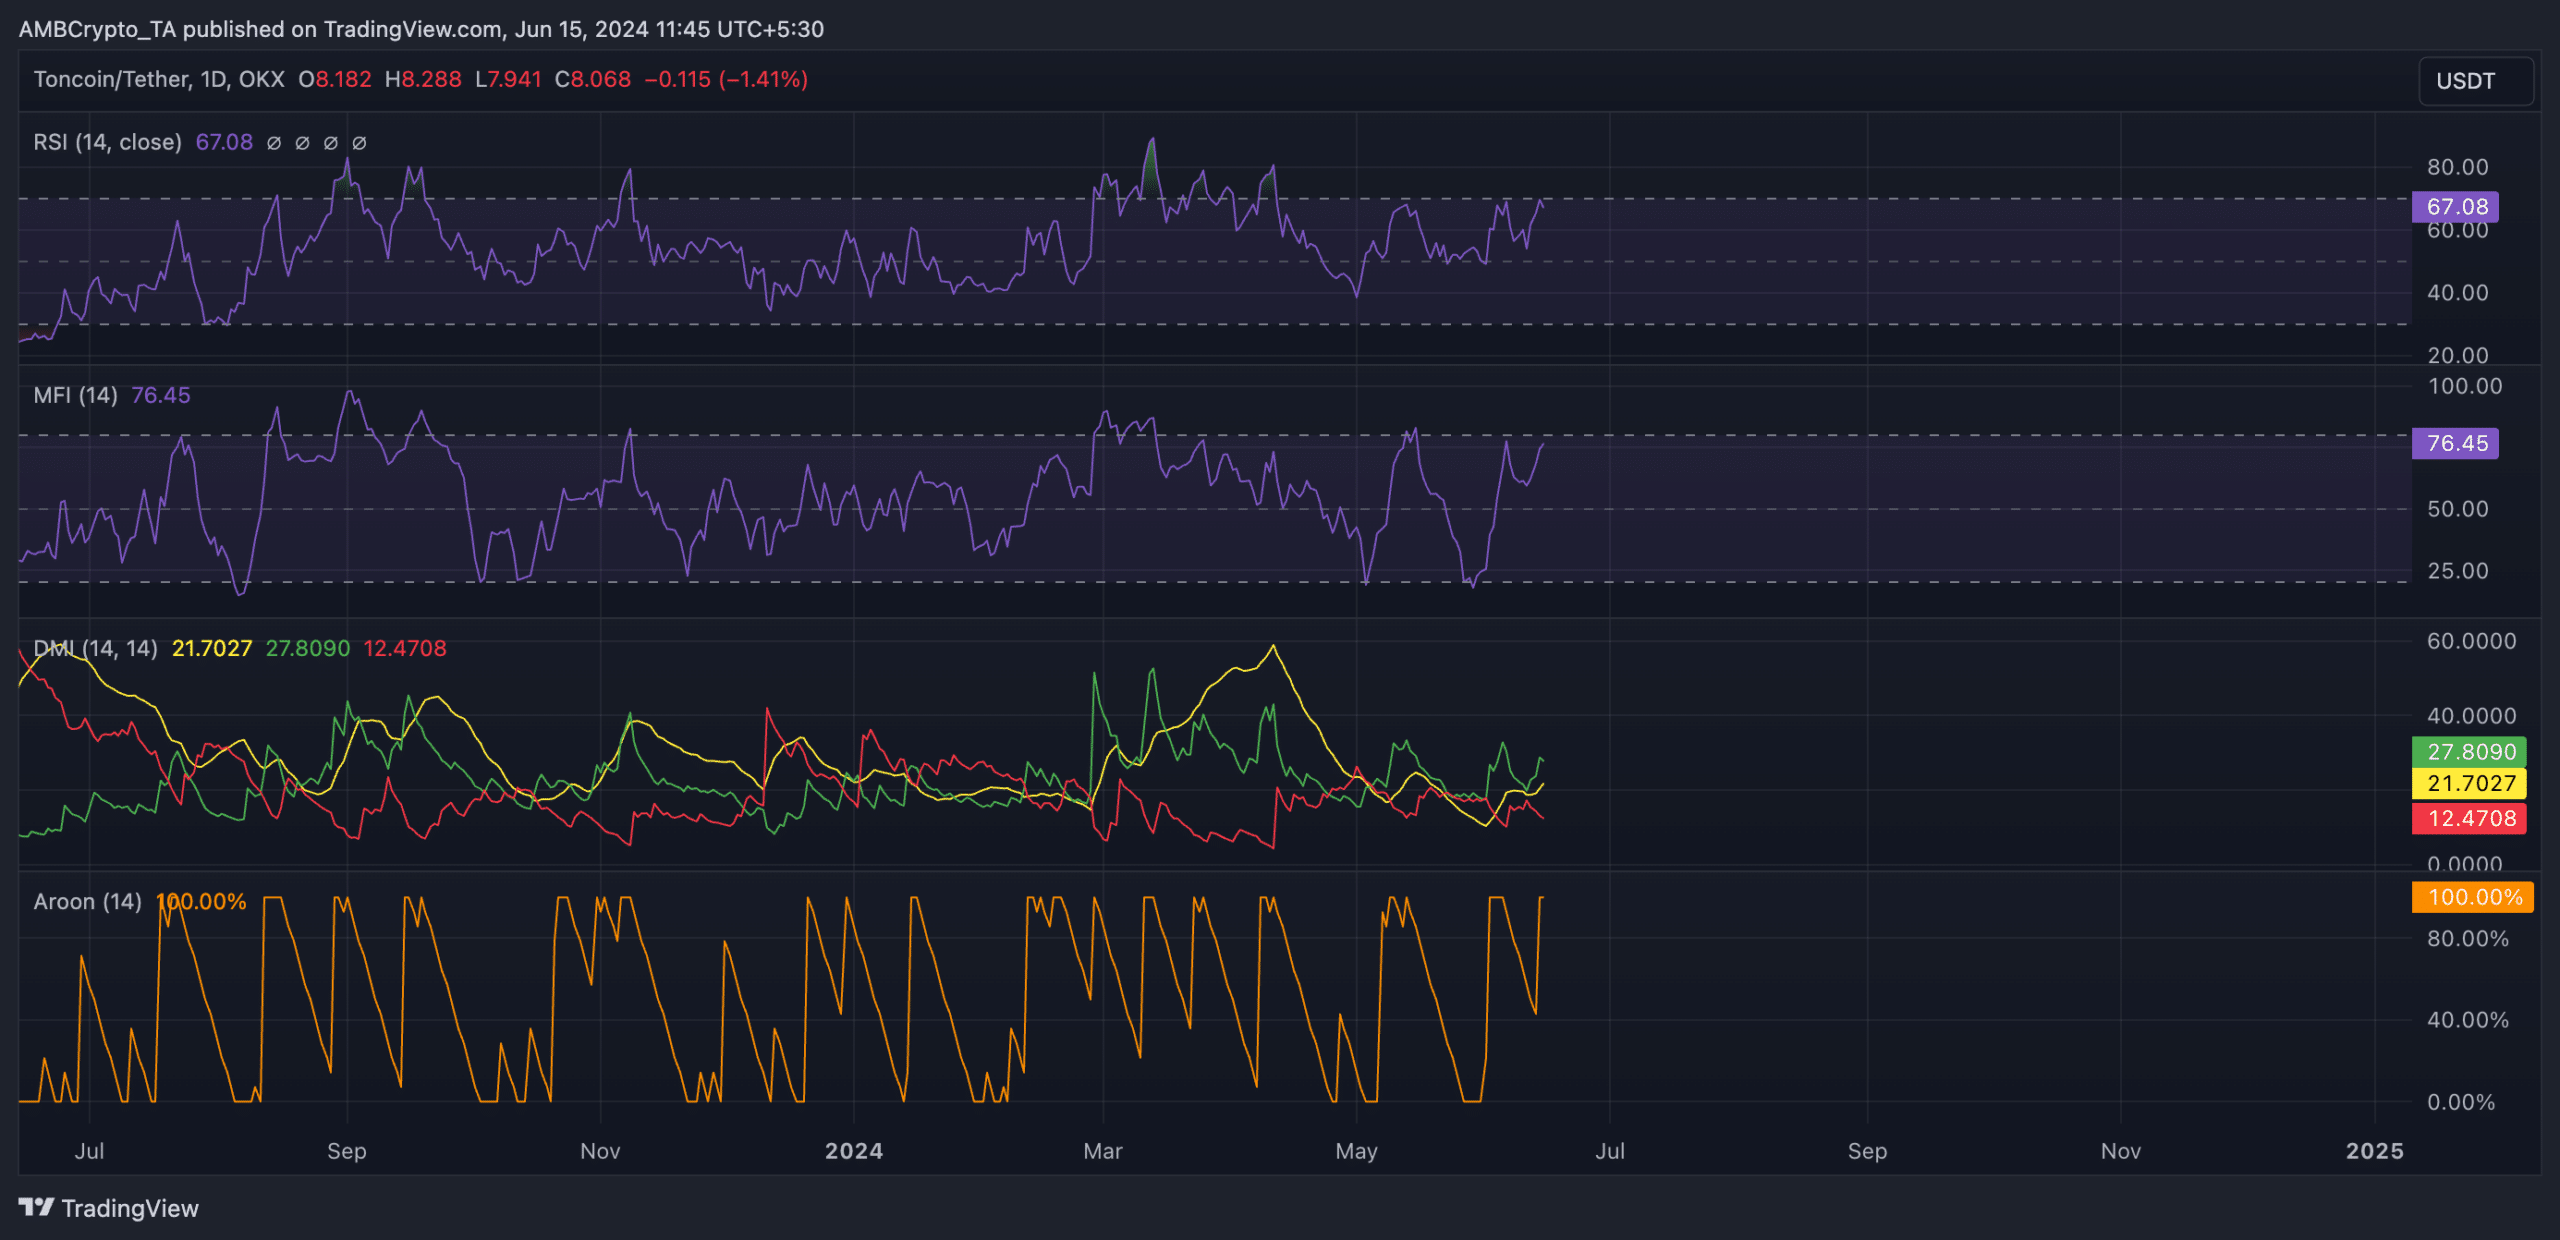
For example, TON’s key momentum indicators rested above their respective center lines, and were rising at the time of writing. Its Relative Strength Index (RSI) was 65.80, while its Money Flow Index (MFI) was 76.42.
These indicators measure overbought and oversold conditions in the market by tracking an asset’s price momentum and changes. At their press time values, TON’s RSI and MFI confirmed the preference of its traders for accumulating over distributing.
Furthermore, readings from TON’s Directional Movement Index (DMI) showed the positive directional index (green) lying above the negative index (red).
An asset’s DMI measures the strength of its price trend. When its positive index rests above the negative index, it suggests a dominant uptrend in the market. This is a bullish signal that traders interpret to mean that bearish influence is significantly low.
TON’s Aroon Up Line was 100% at press time, confirming the prevailing bullish trend. An asset’s Aroon indicator identifies its trend strength and potential price reversal points. When the Aroon Up Line is close to 100 this way, it indicates that the uptrend is strong and that the most recent high was reached relatively recently.
Is your portfolio green? Check the Toncoin [TON] Profit Calculator
Regarding TON’s weighted sentiment, it returned a value of 1.6 at the time of writing. This signalled that most of the discussions around the altcoin on social media platforms have been significantly bullish.
It also meant that TON traders are optimistic and confident that its price will hike even more in the short term.
If this happens, TON may rally to reclaim its all-time high and surge past it.
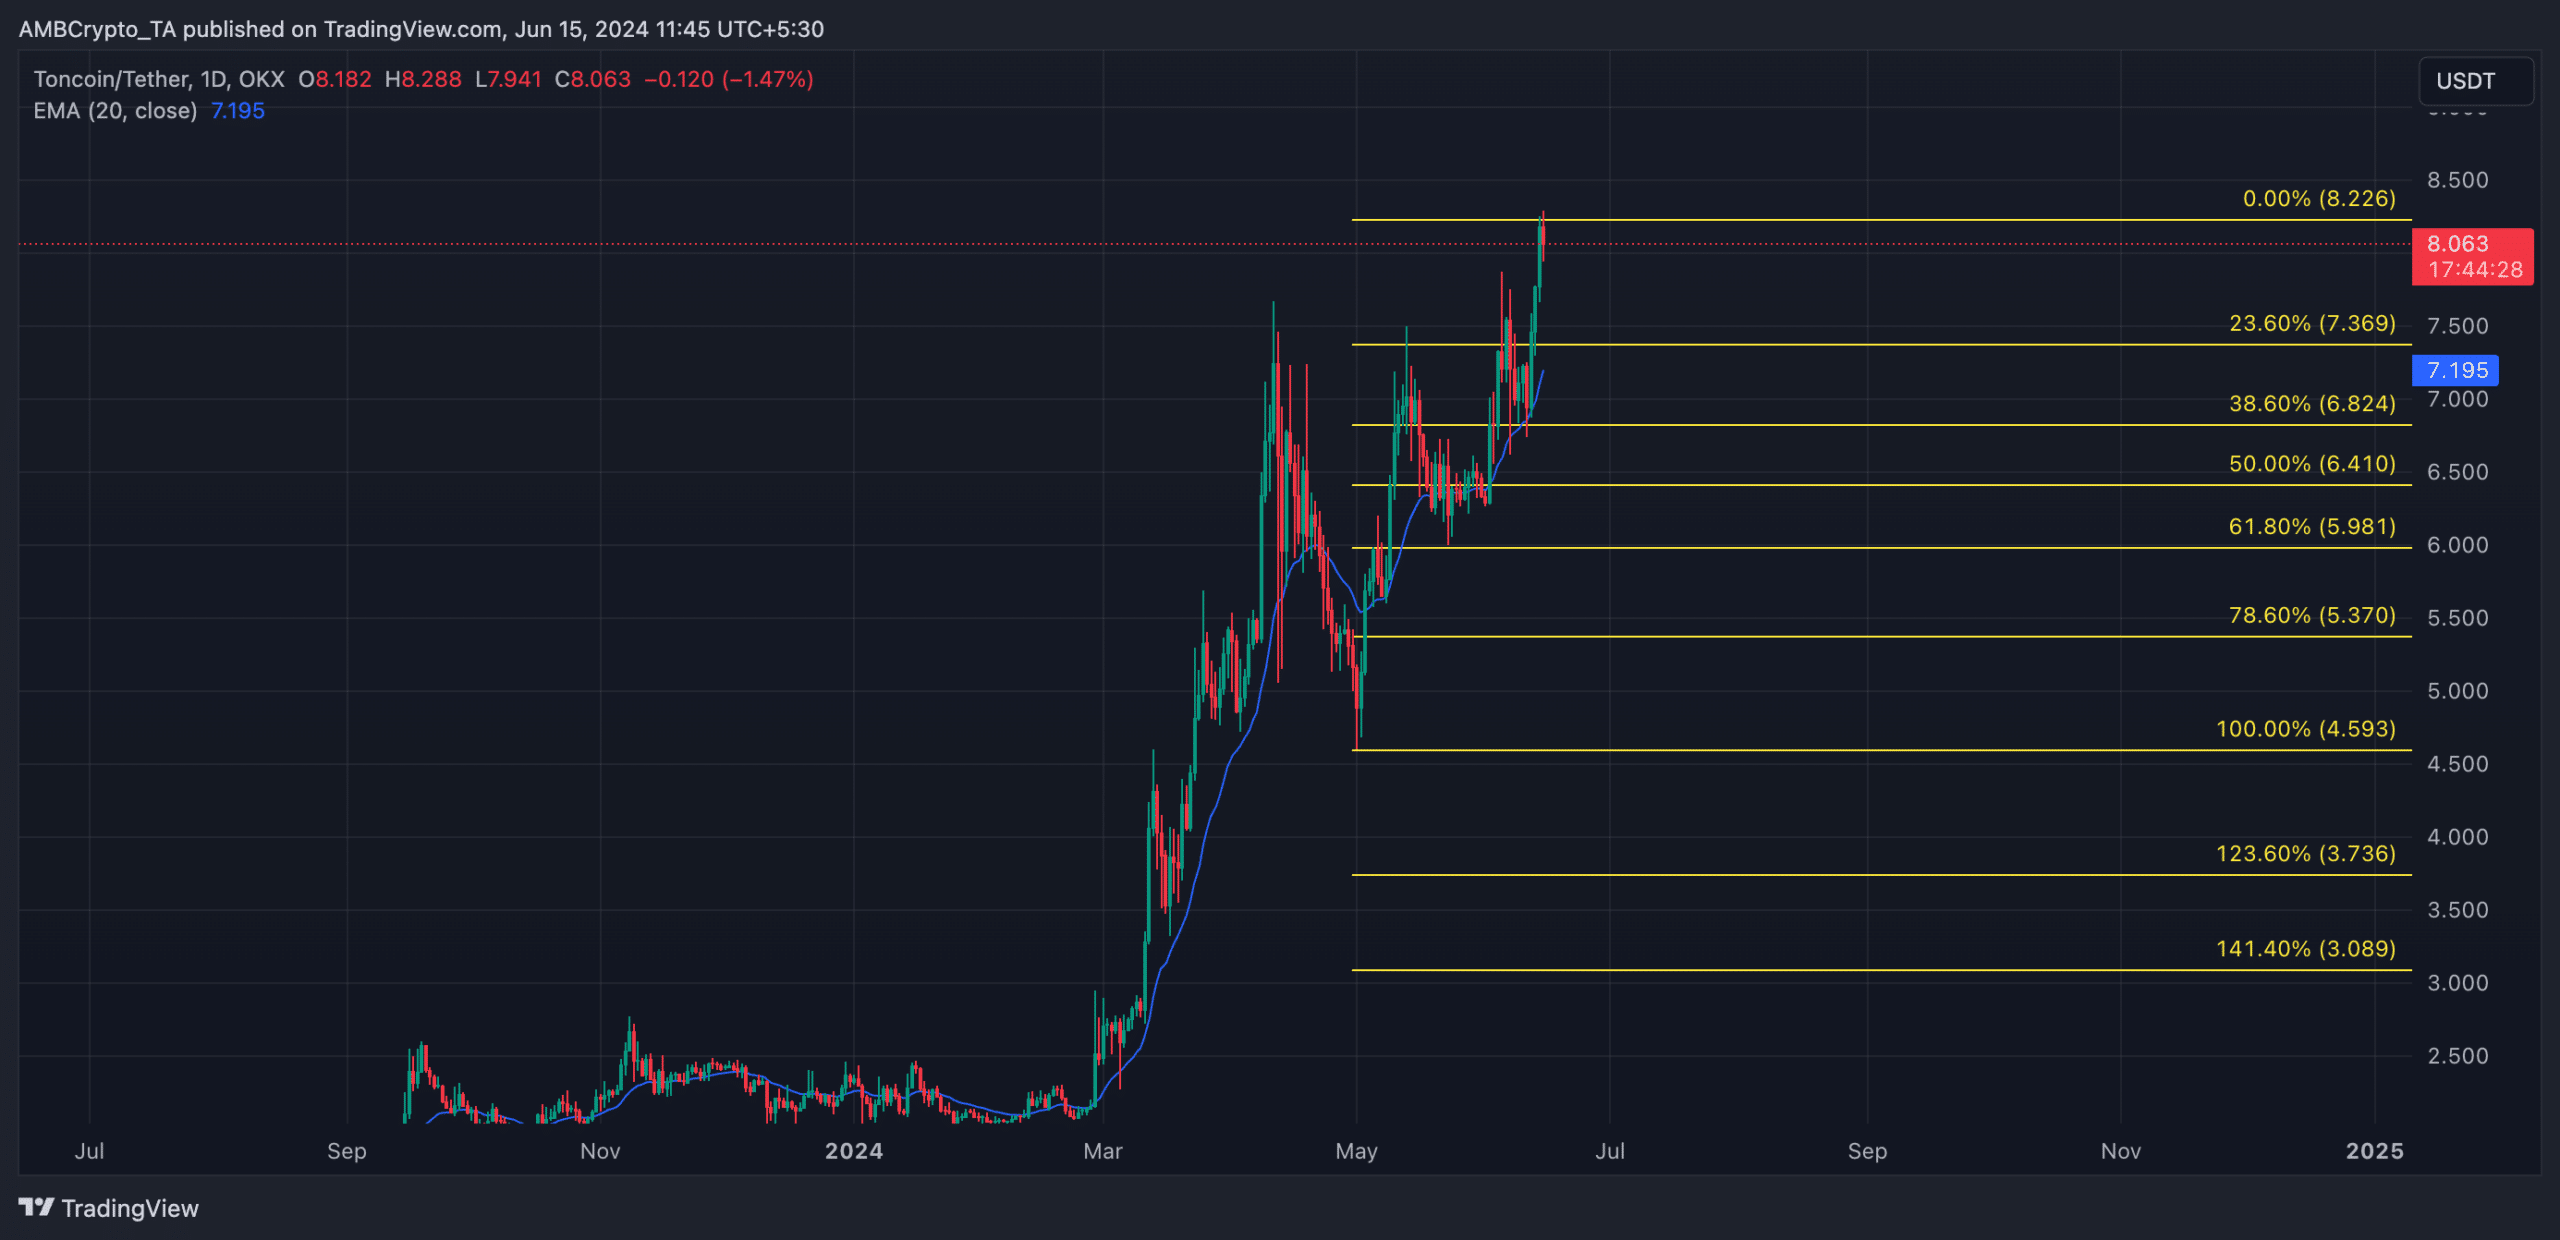
However, if invalidated, the altcoin’s price might drop to $7.36 on the charts.