- Toncoin has a strongly bearish structure on the daily chart.
- The steady whale selling from the distribution chart showed a recovery might be difficult.
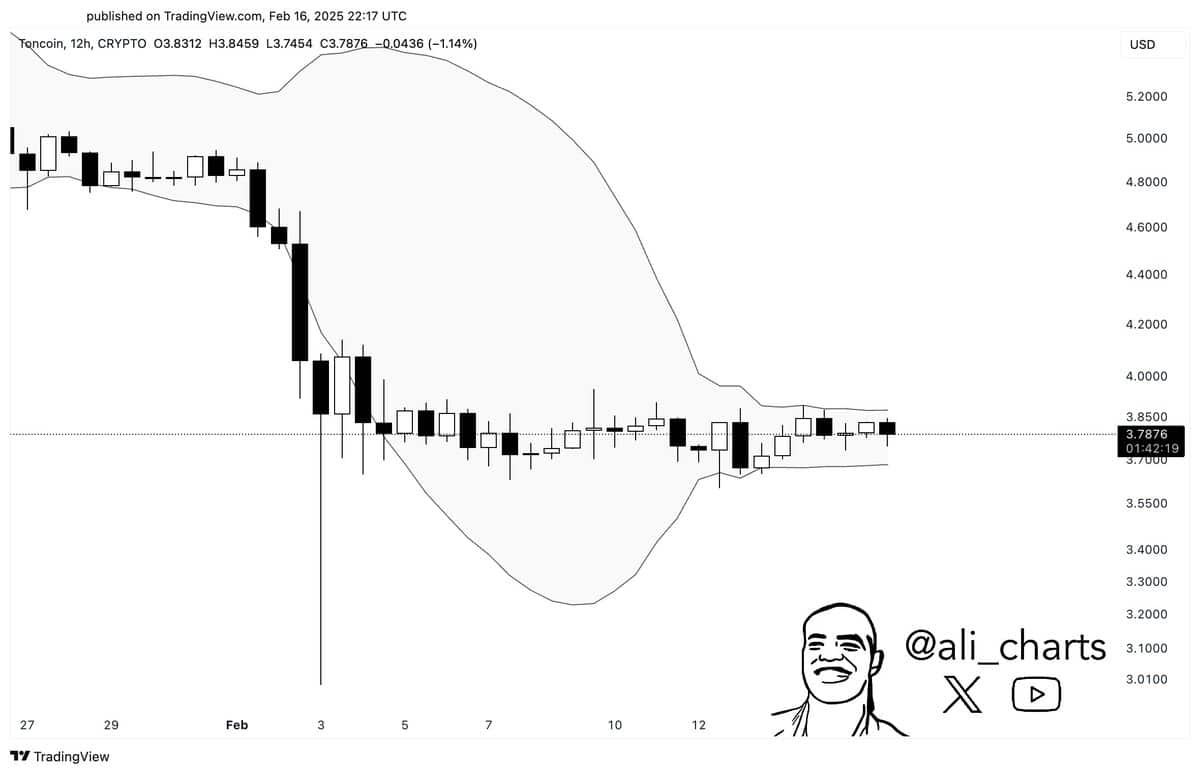
Toncoin [TON] has witnessed vastly reduced volatility in recent days. In a post on X (formerly Twitter), crypto analyst Ali Martinez noted that the Bollinger Bands were squeezing around the TON price on the 12-hour chart.
Source: Ali on X
This reflected the reduced volatility around TON in recent days but also signaled a strong move could be ahead.
A swift price expansion usually follows such periods of low volatility- but which direction would Toncoin go next?
Price action and metrics show caution for buyers
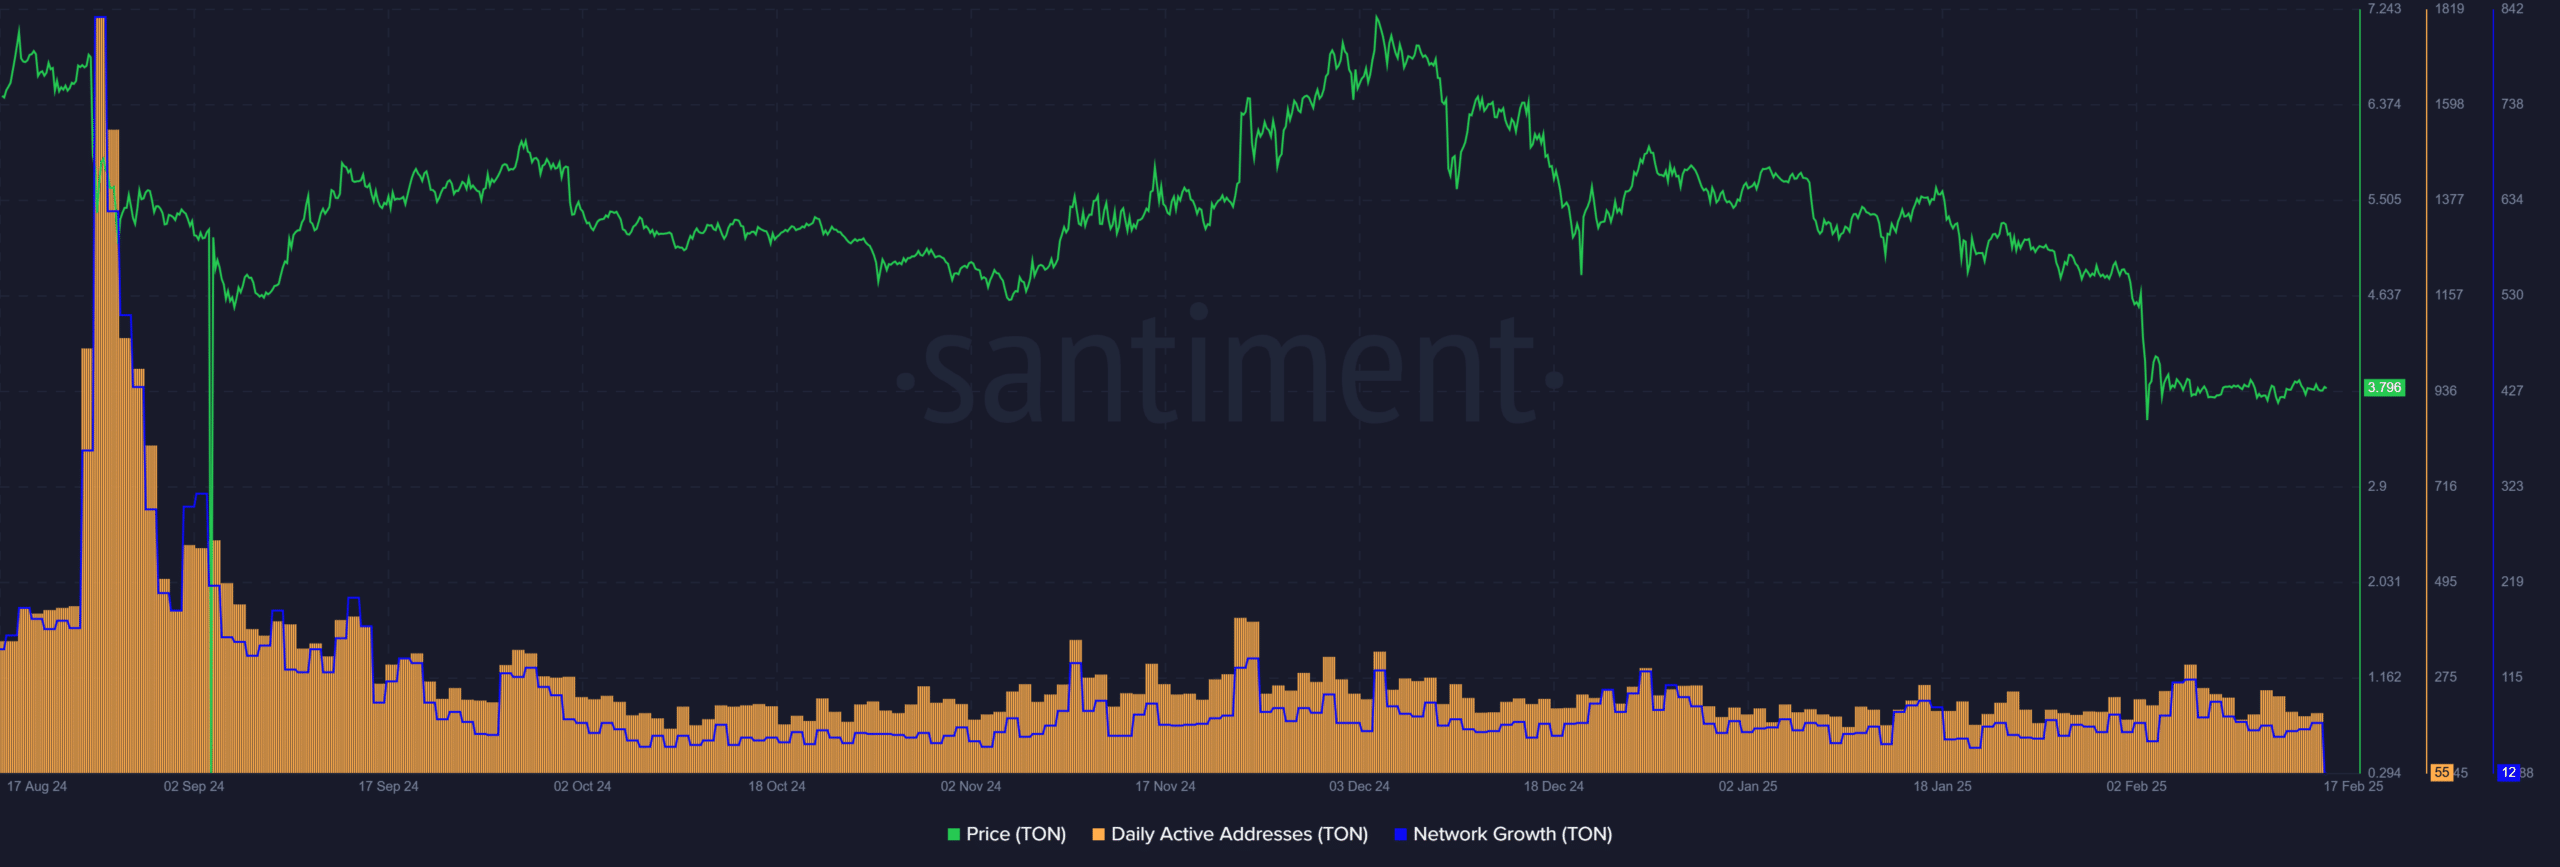
Source: Santiment
The Toncoin network’s daily active addresses saw a large peak back in August, when the price retraced from its rally past $7.5.
Since then, this metric has remained relatively subdued. Even the November rally failed to attract a sizable number of participants.
The network growth, which measures the number of new addresses created on the network, has also maintained its level since October.
Over the past two weeks, both the active addresses and network growth metrics have fallen slightly.
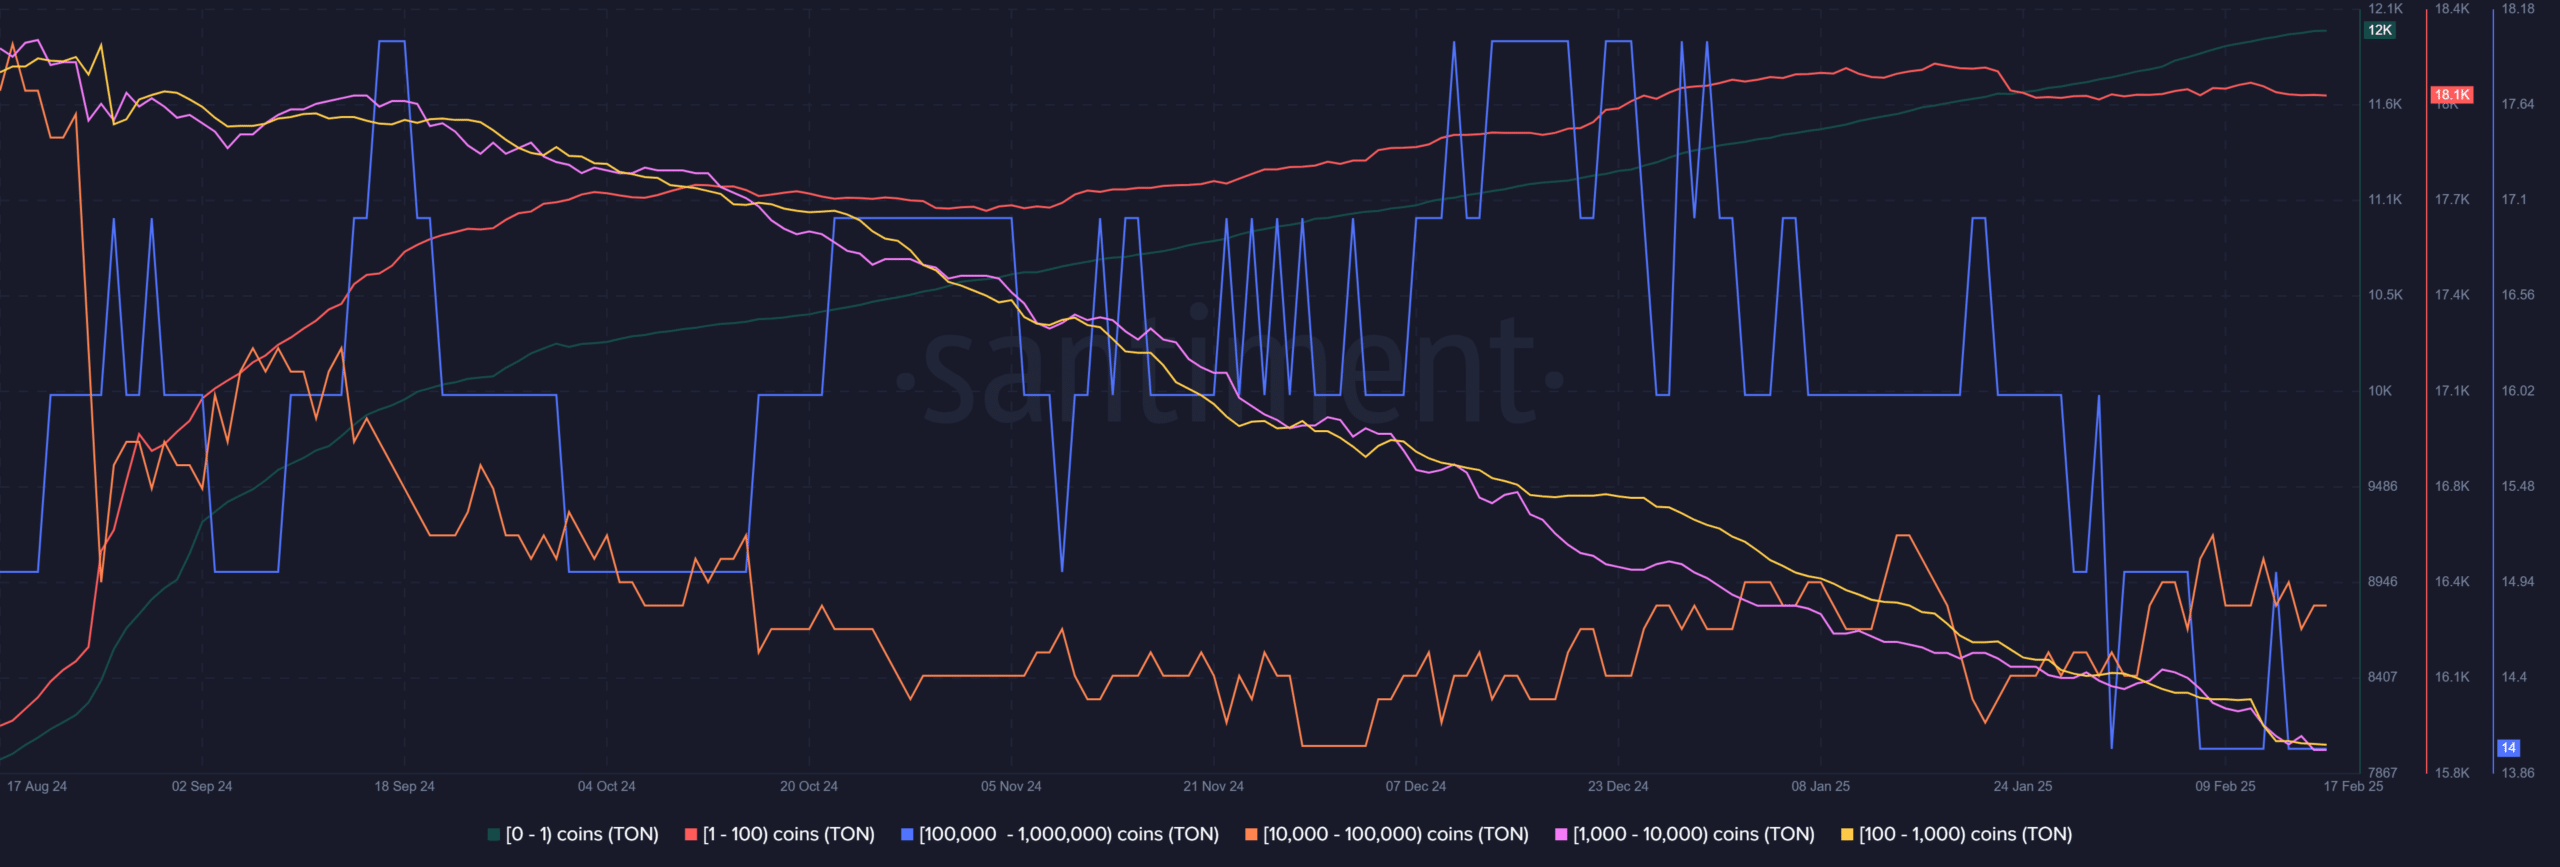
Source: Santiment
The supply distribution chart shows an increase in addresses with small holdings (100 TON or fewer) since October. Addresses with 1–100 TON have maintained their numbers without growth since January 24th.
Meanwhile, larger addresses have steadily dwindled, showing active selling. The 10k-100k cohort has grown over the past three weeks but saw a decline last week.
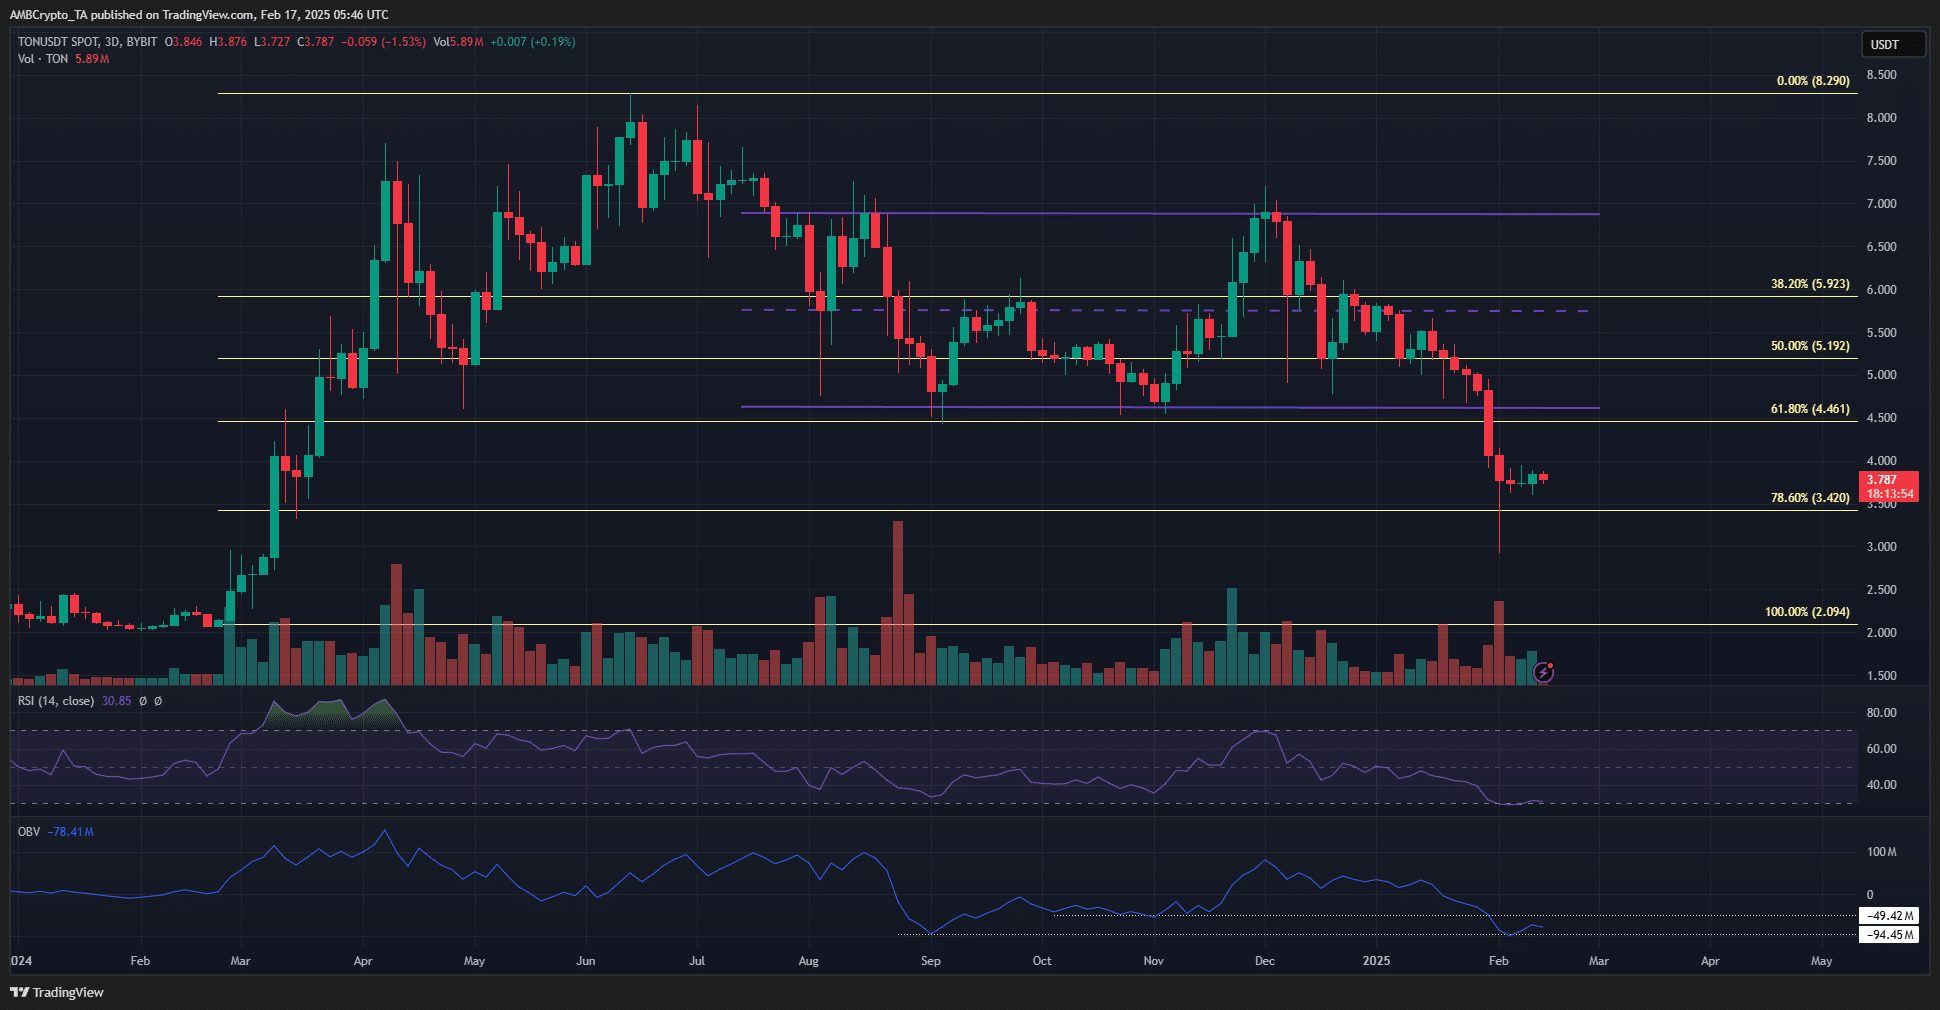
Source: TON/USDT on TradingView
The OBV of Toncoin has sunk below November lows and is holding on to the September lows.
The price has lost the range lows from recent months and has retested the $3.42 support level, which is the 78.6% Fibonacci retracement level.
This critical retracement level was expected to be defended. However, weak network activity and increased selling volume in recent weeks suggest that a price expansion could be southward. The swing market structure is firmly bearish on the daily chart.
A Bitcoin [BTC] resurgence could fuel the altcoin market and inspire Toncoin bulls. Until the $4.5 level is reclaimed as support, swing traders can maintain a bearish bias.