


Tron seemed to be trading within a range and could prove to have some short-term bullish momentum if it rises above $0.0296. Algorand defended a region of demand from the market’s sellers, while Compound saw the strength of its uptrend wobble.
Tron [TRX]
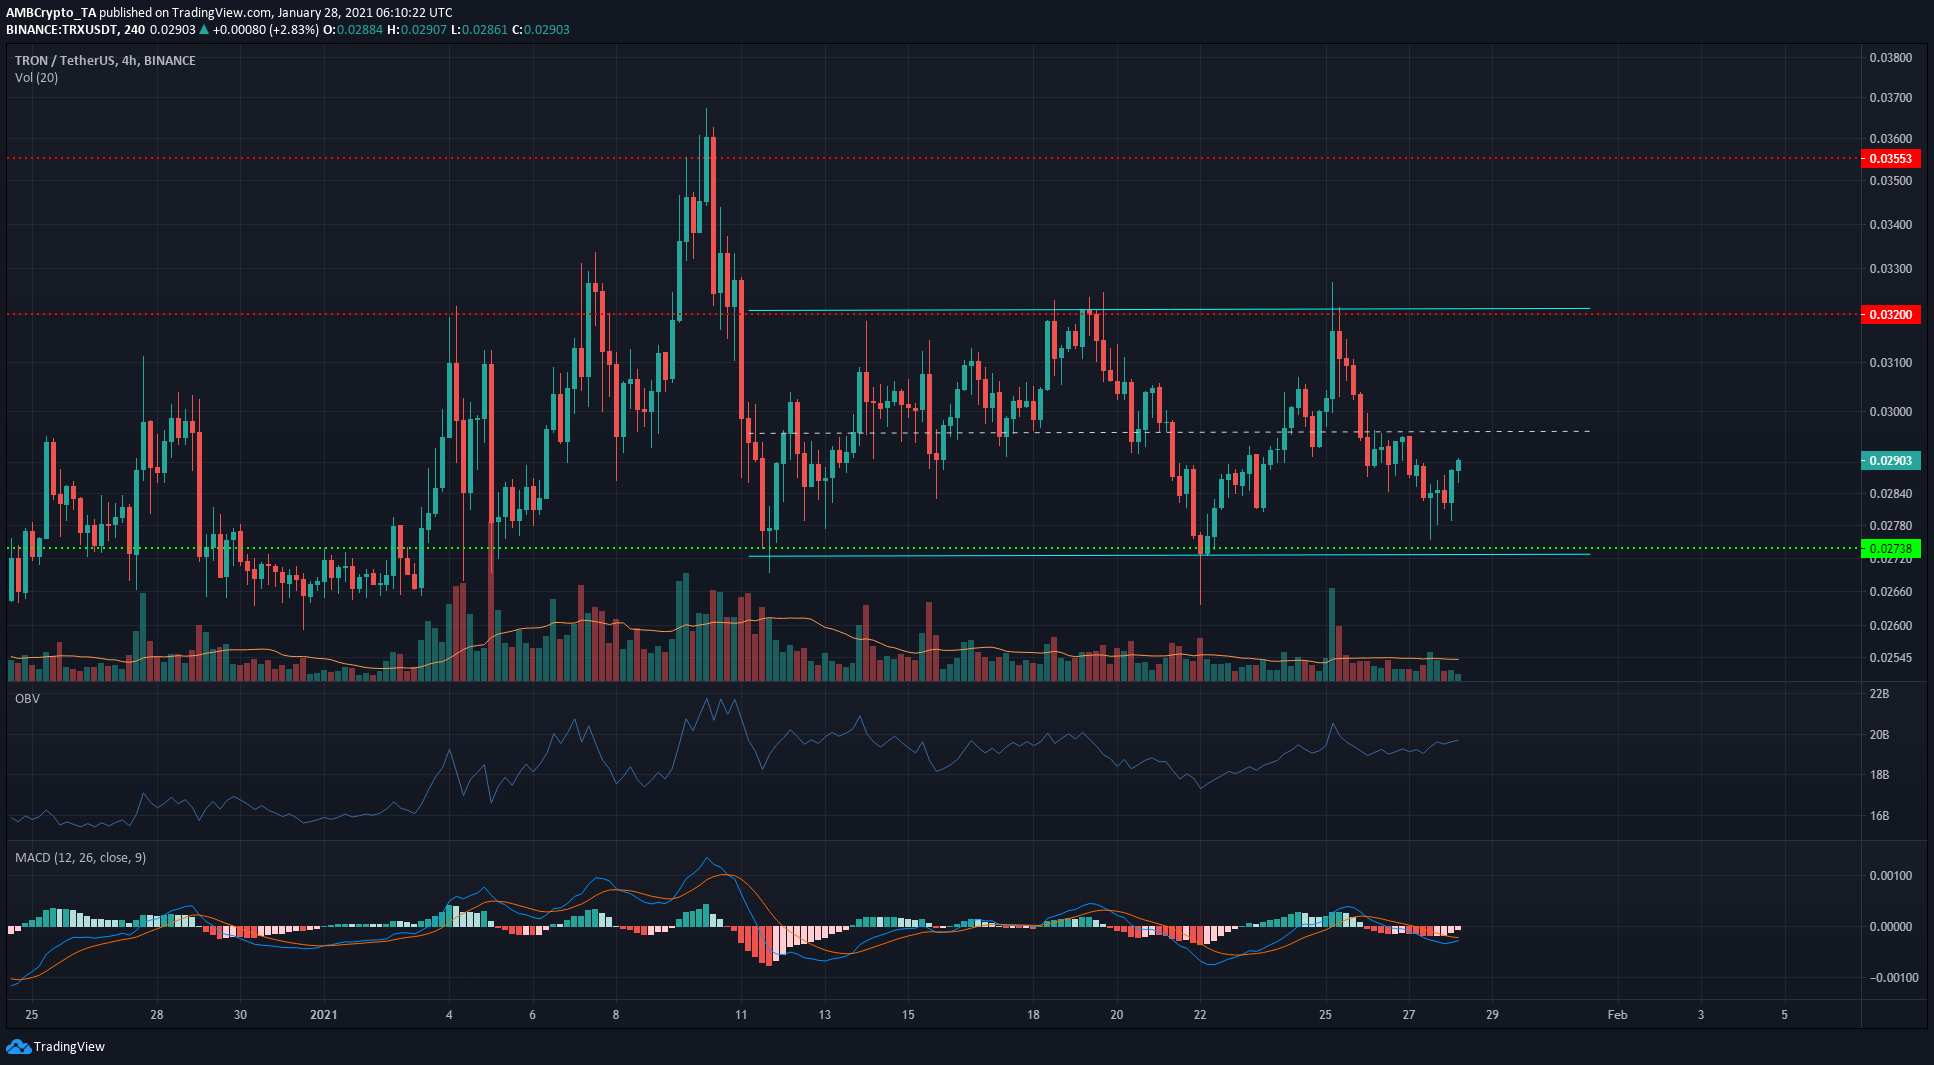
TRX has traded within the range of $0.0272 to $0.0321 (cyan) for over two weeks now. At the time of writing, the price appeared to be heading north to test the mid-point of the range, at $0.0296, as resistance. An advance past this level will see TRX move towards $0.032.
The OBV showed some short-term dominance from buyers and sellers, but overall, the buying and selling volumes have been equal while the price has also been range-bound. This is likely to continue so long as TRX stays within this range.
Finally, the MACD was under zero, but on the verge of forming a bullish crossover.
Algorand [ALGO]
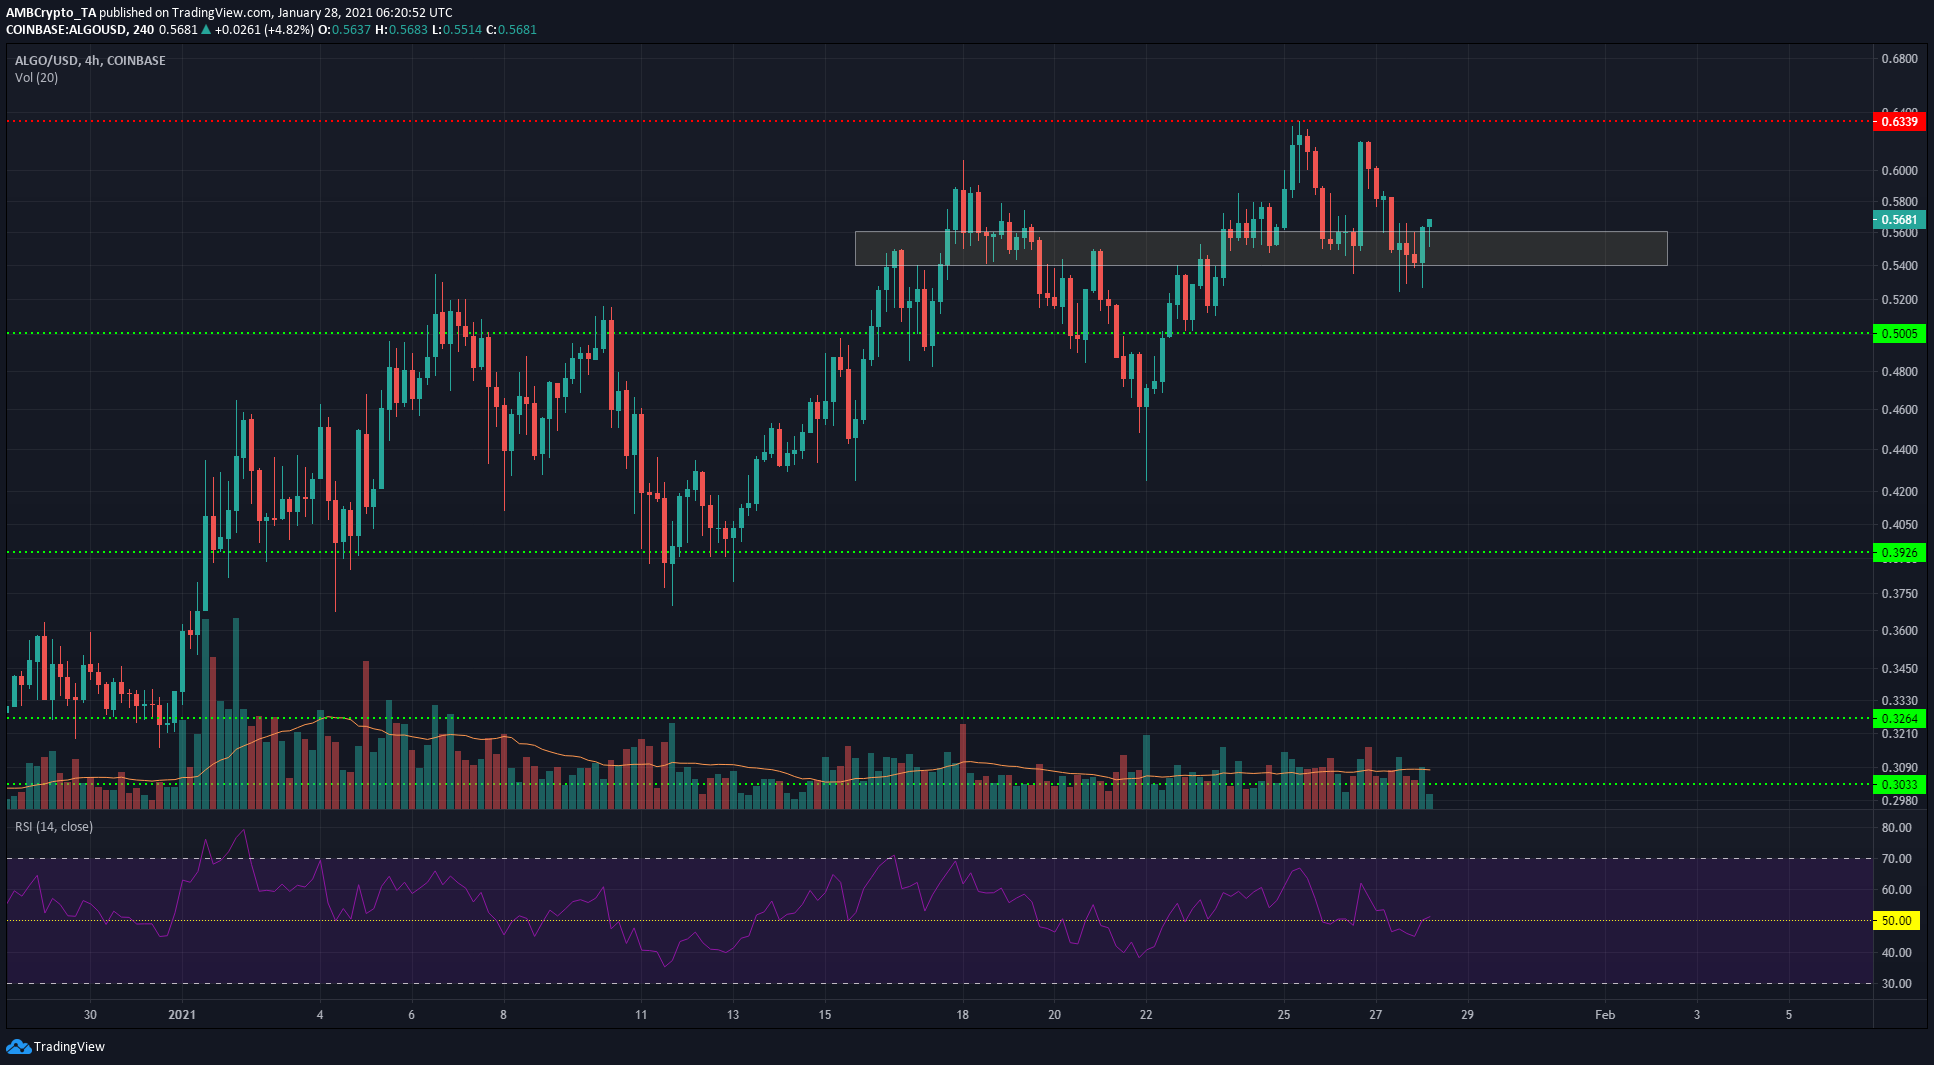
The $0.54-$0.56 zone has served as a region of demand for ALGO for over two weeks now. There was a four-day stint when ALGO slipped beneath this region, but ALGO later recovered to see this area become a buy-order dominated area on the order books.
However, ALGO did not set a new high on the charts. The $0.61-mark saw sellers step in with force, and ALGO was unable even to test the $0.63-resistance on its previous move.
The RSI also sank towards 50 and threatened to slip below the same. Finally, the trading volume has been steady, and a spike accompanying a drop in price below $0.54 would confirm a move to the downside.
Compound [COMP]
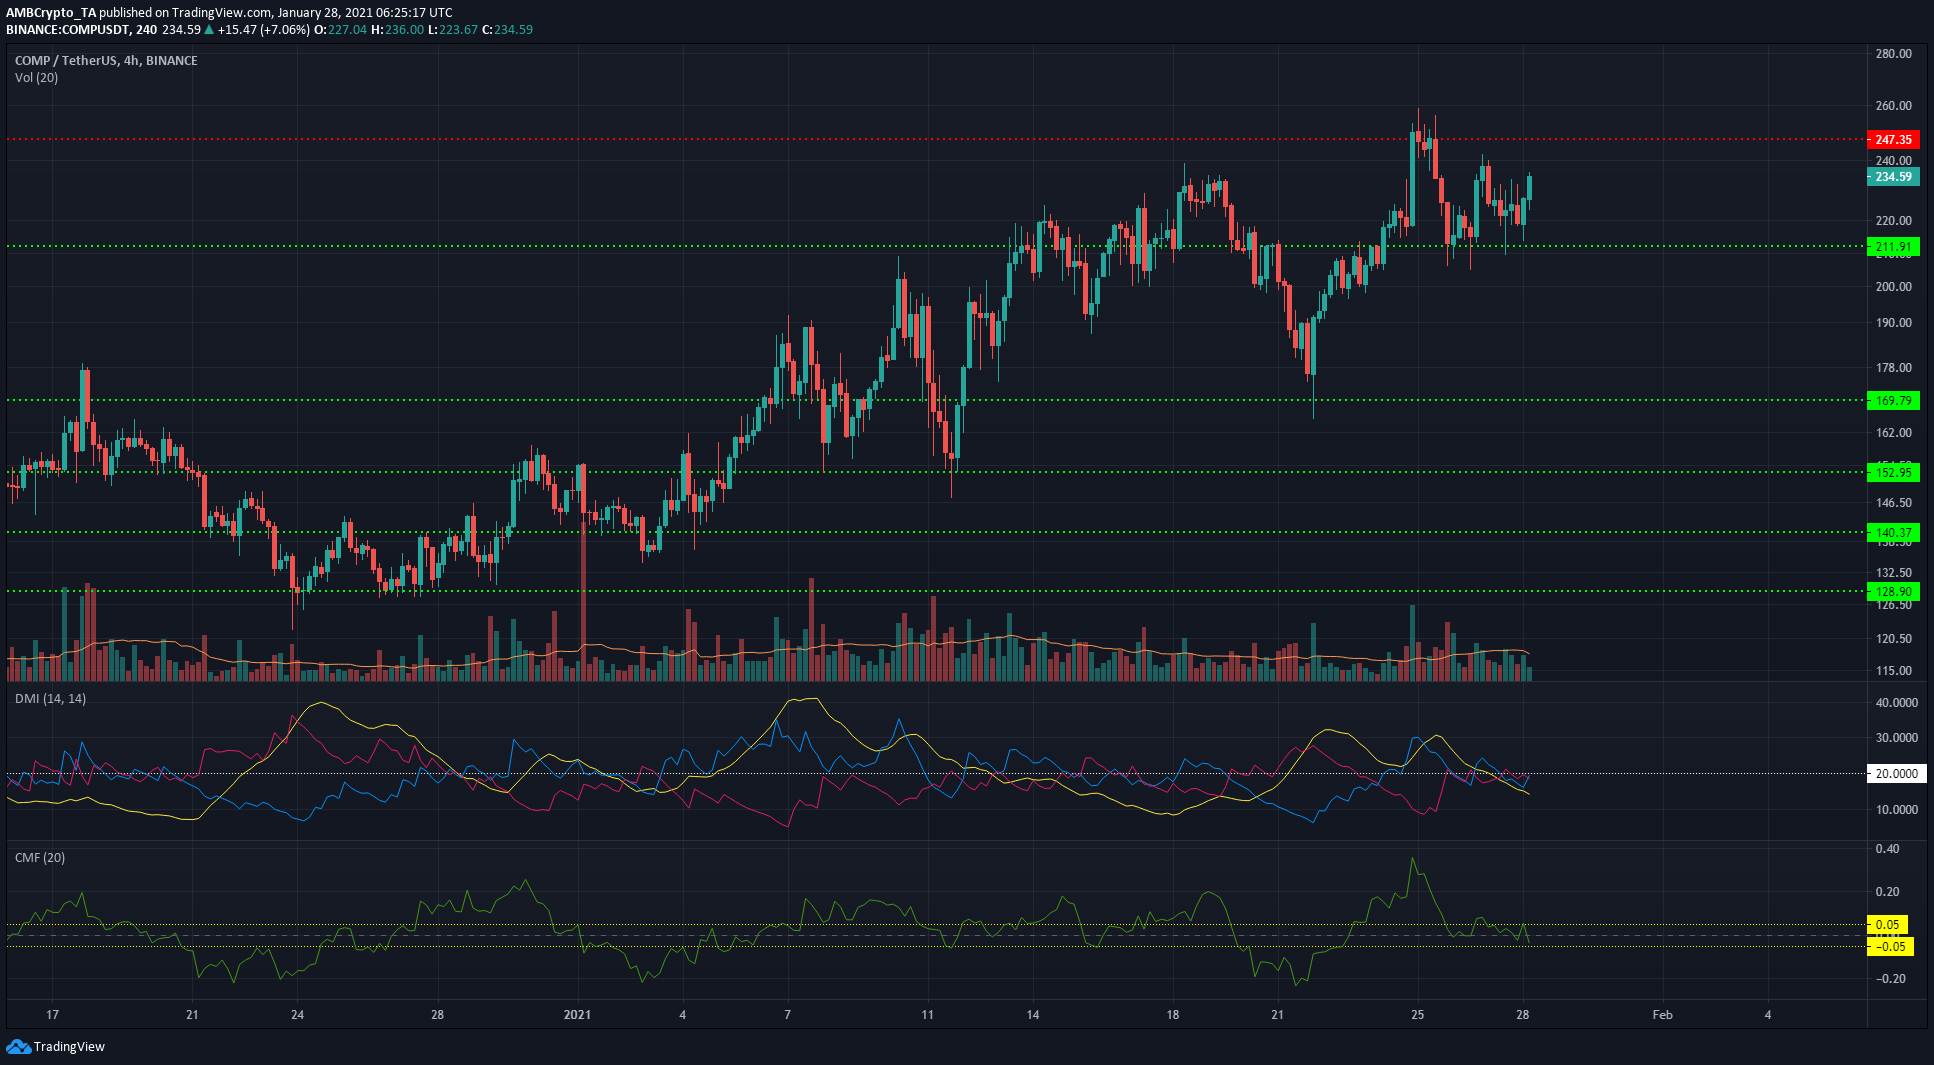
COMP has been on a steady uptrend throughout January. However, the $247-level of resistance rejected the previous northbound move and could offer significant resistance to another retest.
A rejection at the said resistance will see COMP trade within a range from $210 to $250 over the next few days. Moving above the resistance will see the uptrend resume.
Evidence pointed towards weakening upside momentum. The DMI showed the ADX drop below 20 to indicate the falling trend’s strength, and the Chaikin Money Flow was also reverting to the mean and could soon point to capital leaving the markets if it continues to fall.