


Tron presented a target at $0.18 in case of a breakout above $1.35. BitTorrent resumed its consolidation between $0.0077 and $0.0066, while Ethereum Classic highlighted a pullback at $48 or even $42 before its next leg upwards.
Tron [TRX]

Although the first couple of weeks in April were extremely bullish for Tron, a broader market pullback hampered its upwards trajectory. After forming a local top at $0.18, the ‘Ethereum rival’ shed 50% of its value and dropped as low as $0.09. Since the last week of April, TRX has been in recovery mode and the price has steadily captured key levels on the 4-hour timeframe. The next target for the bulls lay between $0.1.35-$0.148. While there was some resistance present in this region, the market looked bullish enough for a breakout in the coming days. Levels to look out for include $0.165 and $0.18 in a favorable outcome.
On the technicals side, MACD’s Fast-moving line crossed above the Signal line. ADX pointed north from 20 as a strong trend was in the making.
BitTorrent [BTT]
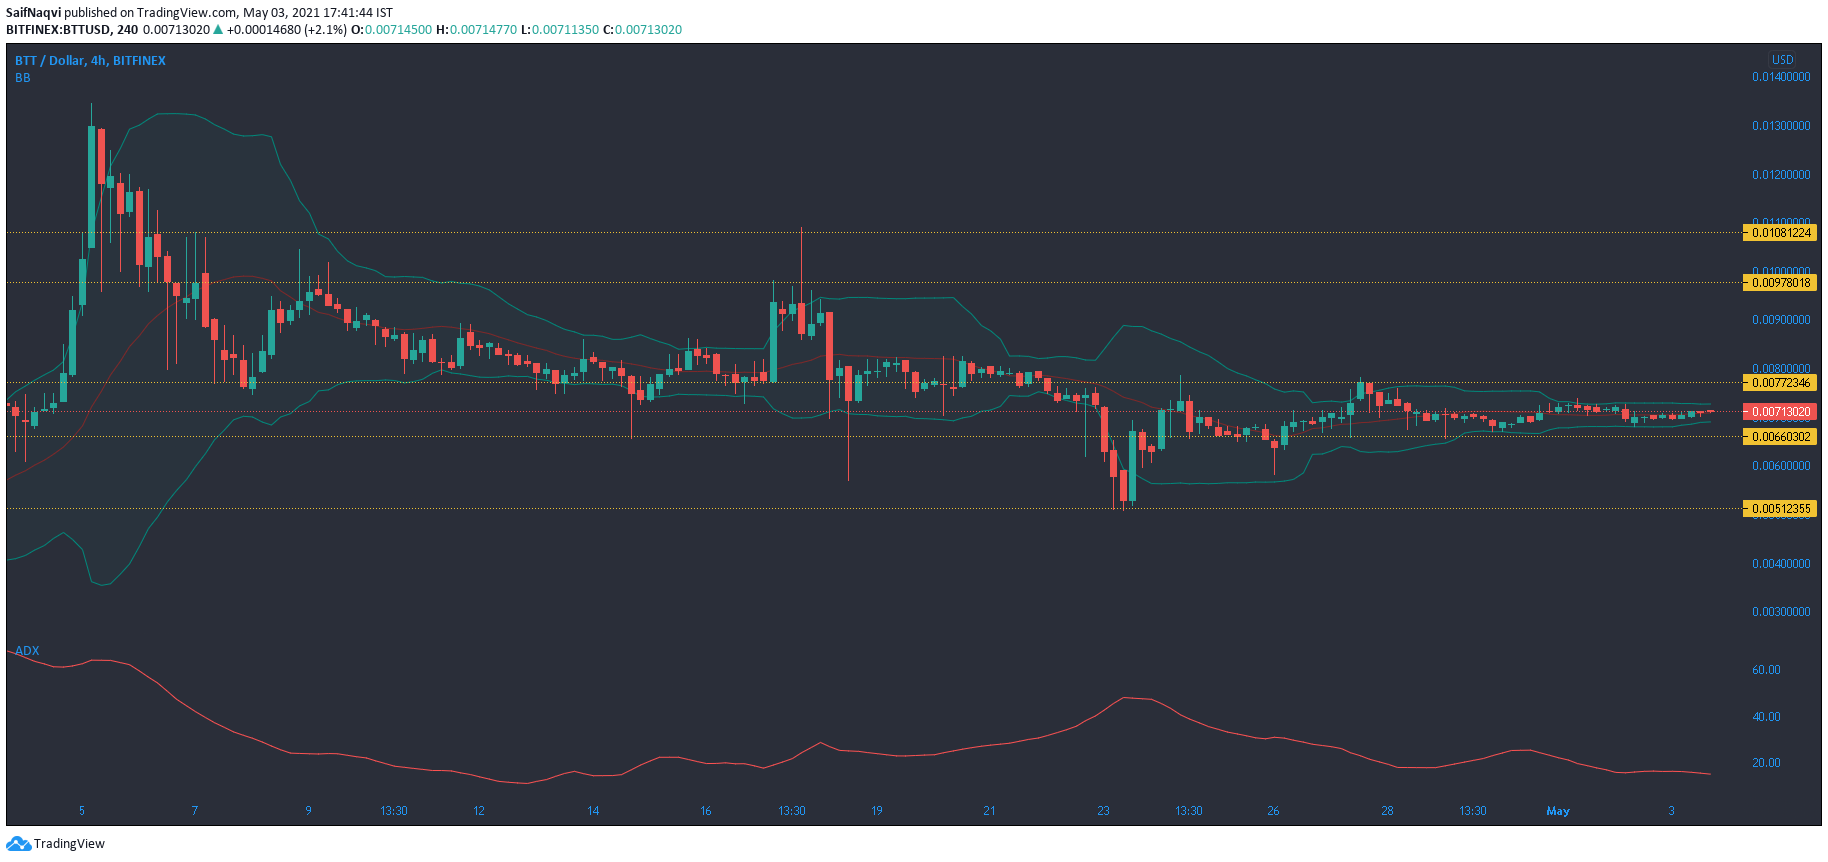
There was little to report in the BitTorrent market as the price remained in consolidation between $0.0077 and $0.0066. Bollinger Bands were constricted and low volatility disallowed for sharp movements.
ADX languished at 16 and highlighted the lack of a strong trend. It was possible that BTT was in accumulation before the next swing and if that was the case, traders could sell on resistance and buy at support. A major resistance level resided at $0.0097 and a breakout above this could see gains all the way towards its April ATH.
Ethereum Classic [ETC]

Using Ethereum Classic’s movement between April 14-17 as reference points, some Fibonacci levels were highlighted on the 4-hour timeframe. The 100% extension level rested at $54.7 but a look at the on-chain metrics suggested a pullback even though ETC was quite bullish over the last 24-hours. RSI highlighted overbought conditions in the market for the last few days and stabilization was likely moving forward. This could take place at the 78.6% Fibonacci level ($48.3) which would establish it as a strong support point.
Another area of support rested at $42-43 and this even coincided with the 50-SMA (blue). Meanwhile, Chainkin Money Flow maintained itself above the half-line as capital inflows were healthy towards ETC.