Tron, Decentraland, Axie Infinity Price Analysis: 24 March

After a significant weekly climb on the Bitcoin fear and greed index, Tron crossed above the 38.2% Fibonacci level while marking an overbought position on its technicals.
Furthermore, Decentraland and Axie Infinity saw a break above their month-long trendline resistance and also revealed overbought readings on their near-term technicals.
Tron (TRX)

Since approaching its long-term resistance at $0.129, TRX lost over 60% of its value and plunged towards its six-month low on 24 January. Since then, the bulls have propelled a gradual recovery.
The 61.8% Fibonacci resistance shunned all substantial bullish recovery attempts from the $0.05 floor. Nevertheless, its trendline support (yellow, dashed) stood sturdy. Over the past two days, bulls found a close above the critical 38.2% resistance. Further, the 20 EMA (red) and 50 EMA (cyan) crossed the 200 EMA (green). Thus, revealing a golden cross on its 4-hour chart.
At press time, TRX traded at $0.064. The RSI approached to retest the overbought territory near the 70-mark. From here, a likely reversal would confirm a bearish divergence, leading to a short-term pullback.
Decentraland (MANA)
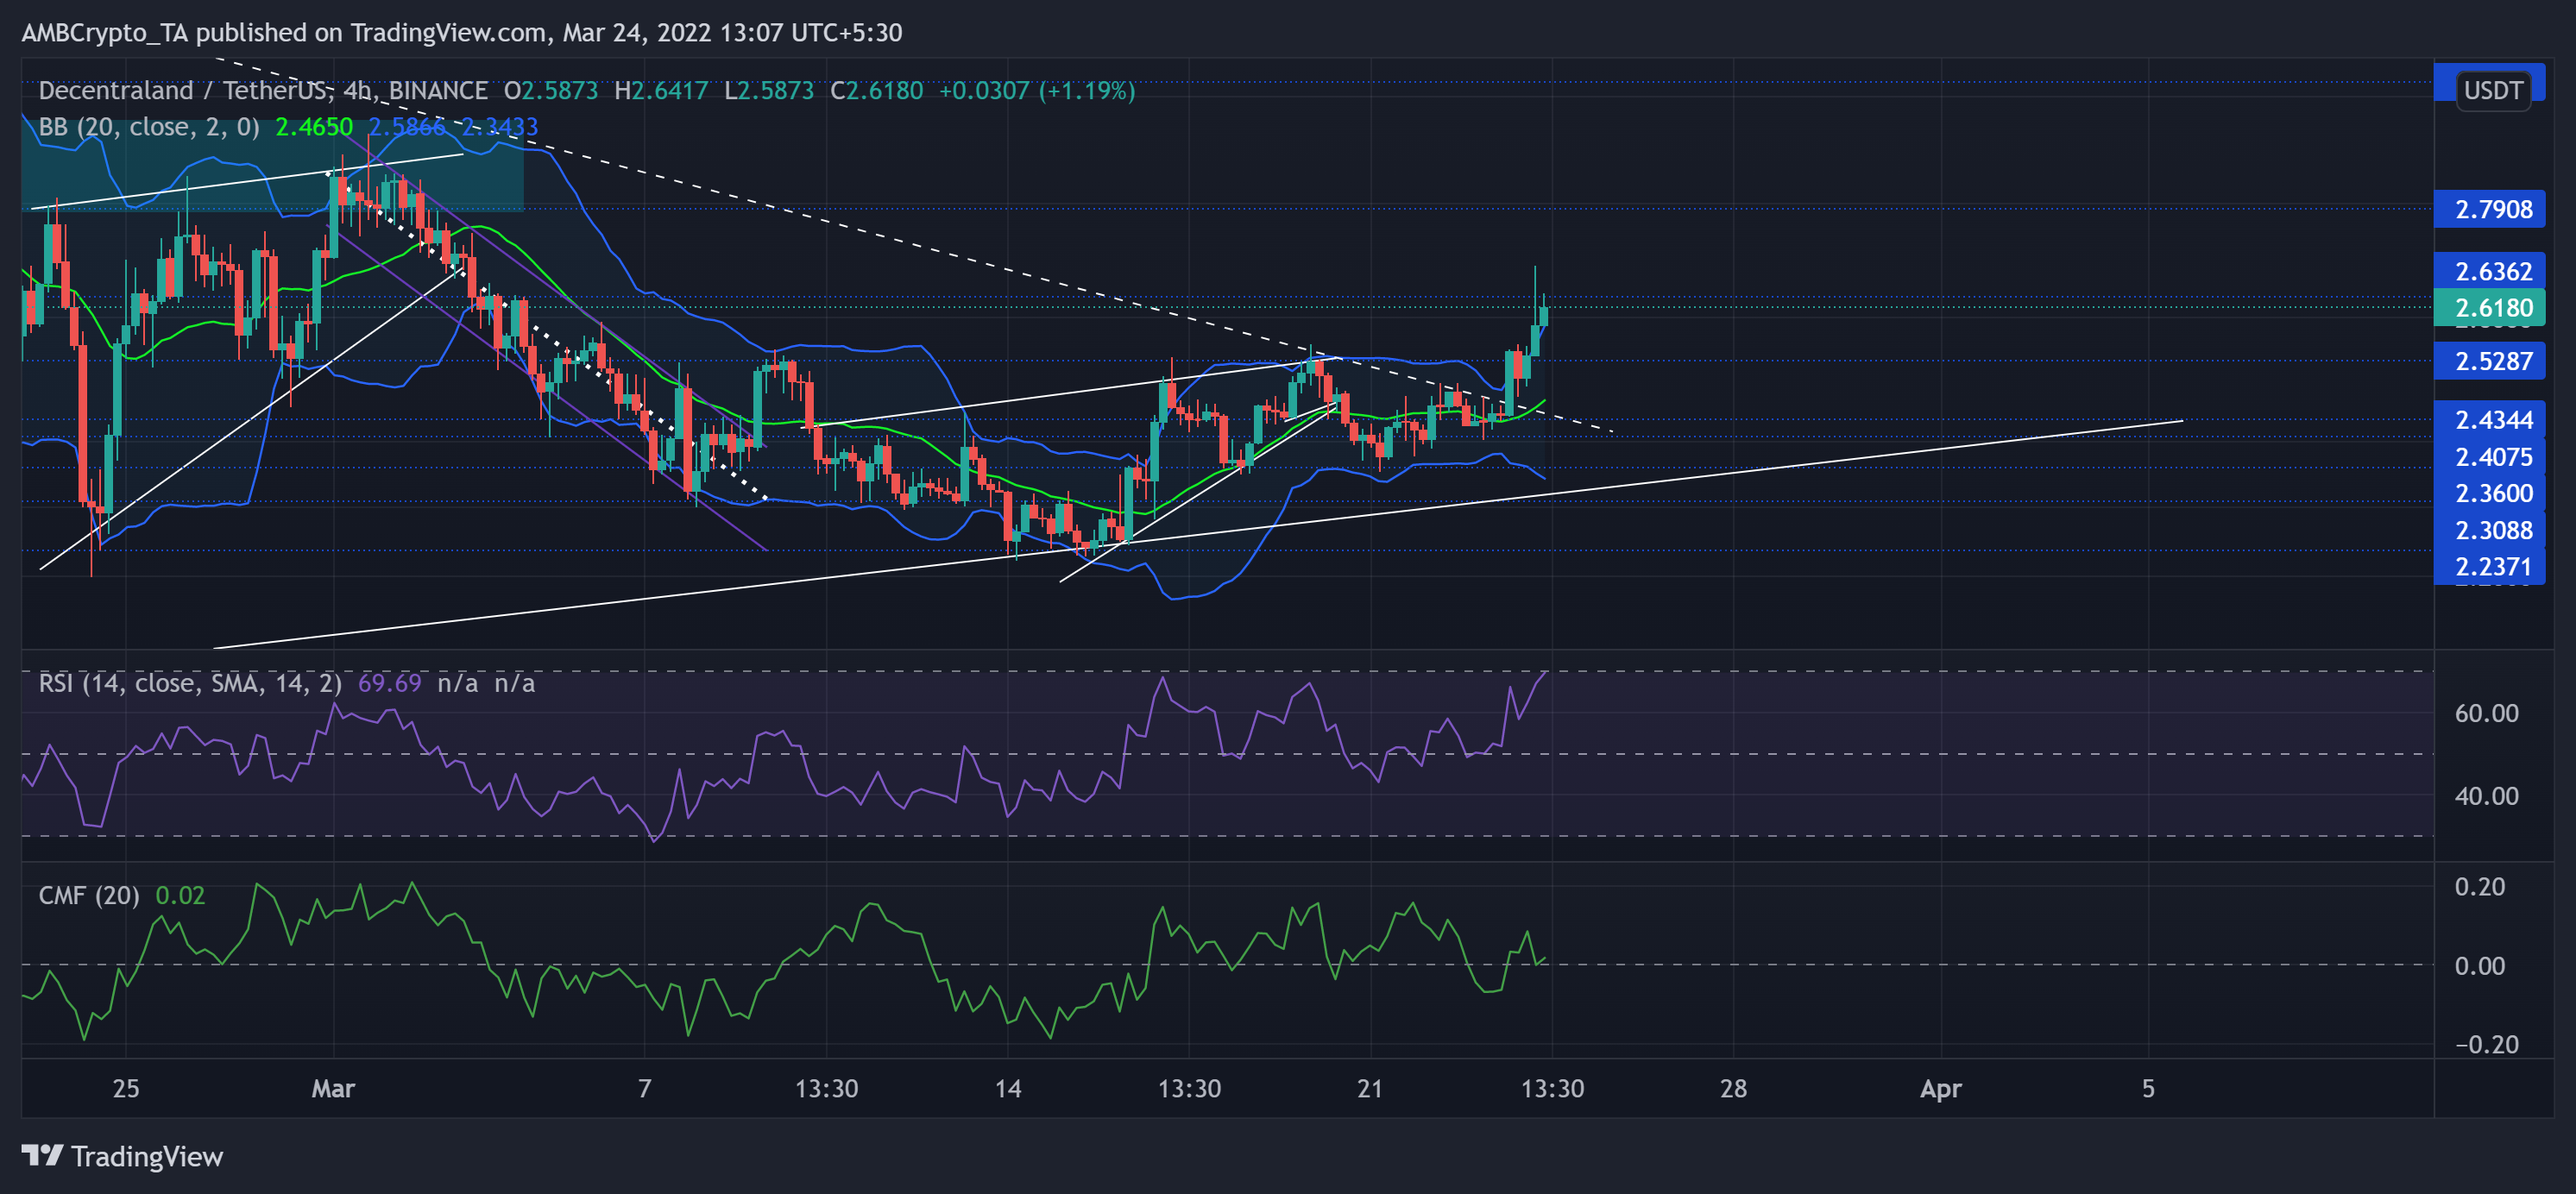
In its descent from its ATH, MANA lost over 70% of its value and hit its 11-week low on 22 January. Since then, it has seen a strong recovery that faced resistance at its month-long trendline resistance until 23 March.
The recent rising wedge breakdown saw a solid revival from the $2.3-level. As a result, the alt was up by nearly 11% in just the last three days. With this rally, bulls flipped the long-term trendline resistance to support. Consequently, the price kept hovering above the upper band of the Bollinger Bands.
At press time, MANA was trading at $2.618. The RSI headed into the 70- region and confirmed an overbought situation for the alt. Furthermore, the CMF ensured the zero-line as immediate support and affirmed the edge in favor of bulls.
Axie Infinity (AXS)
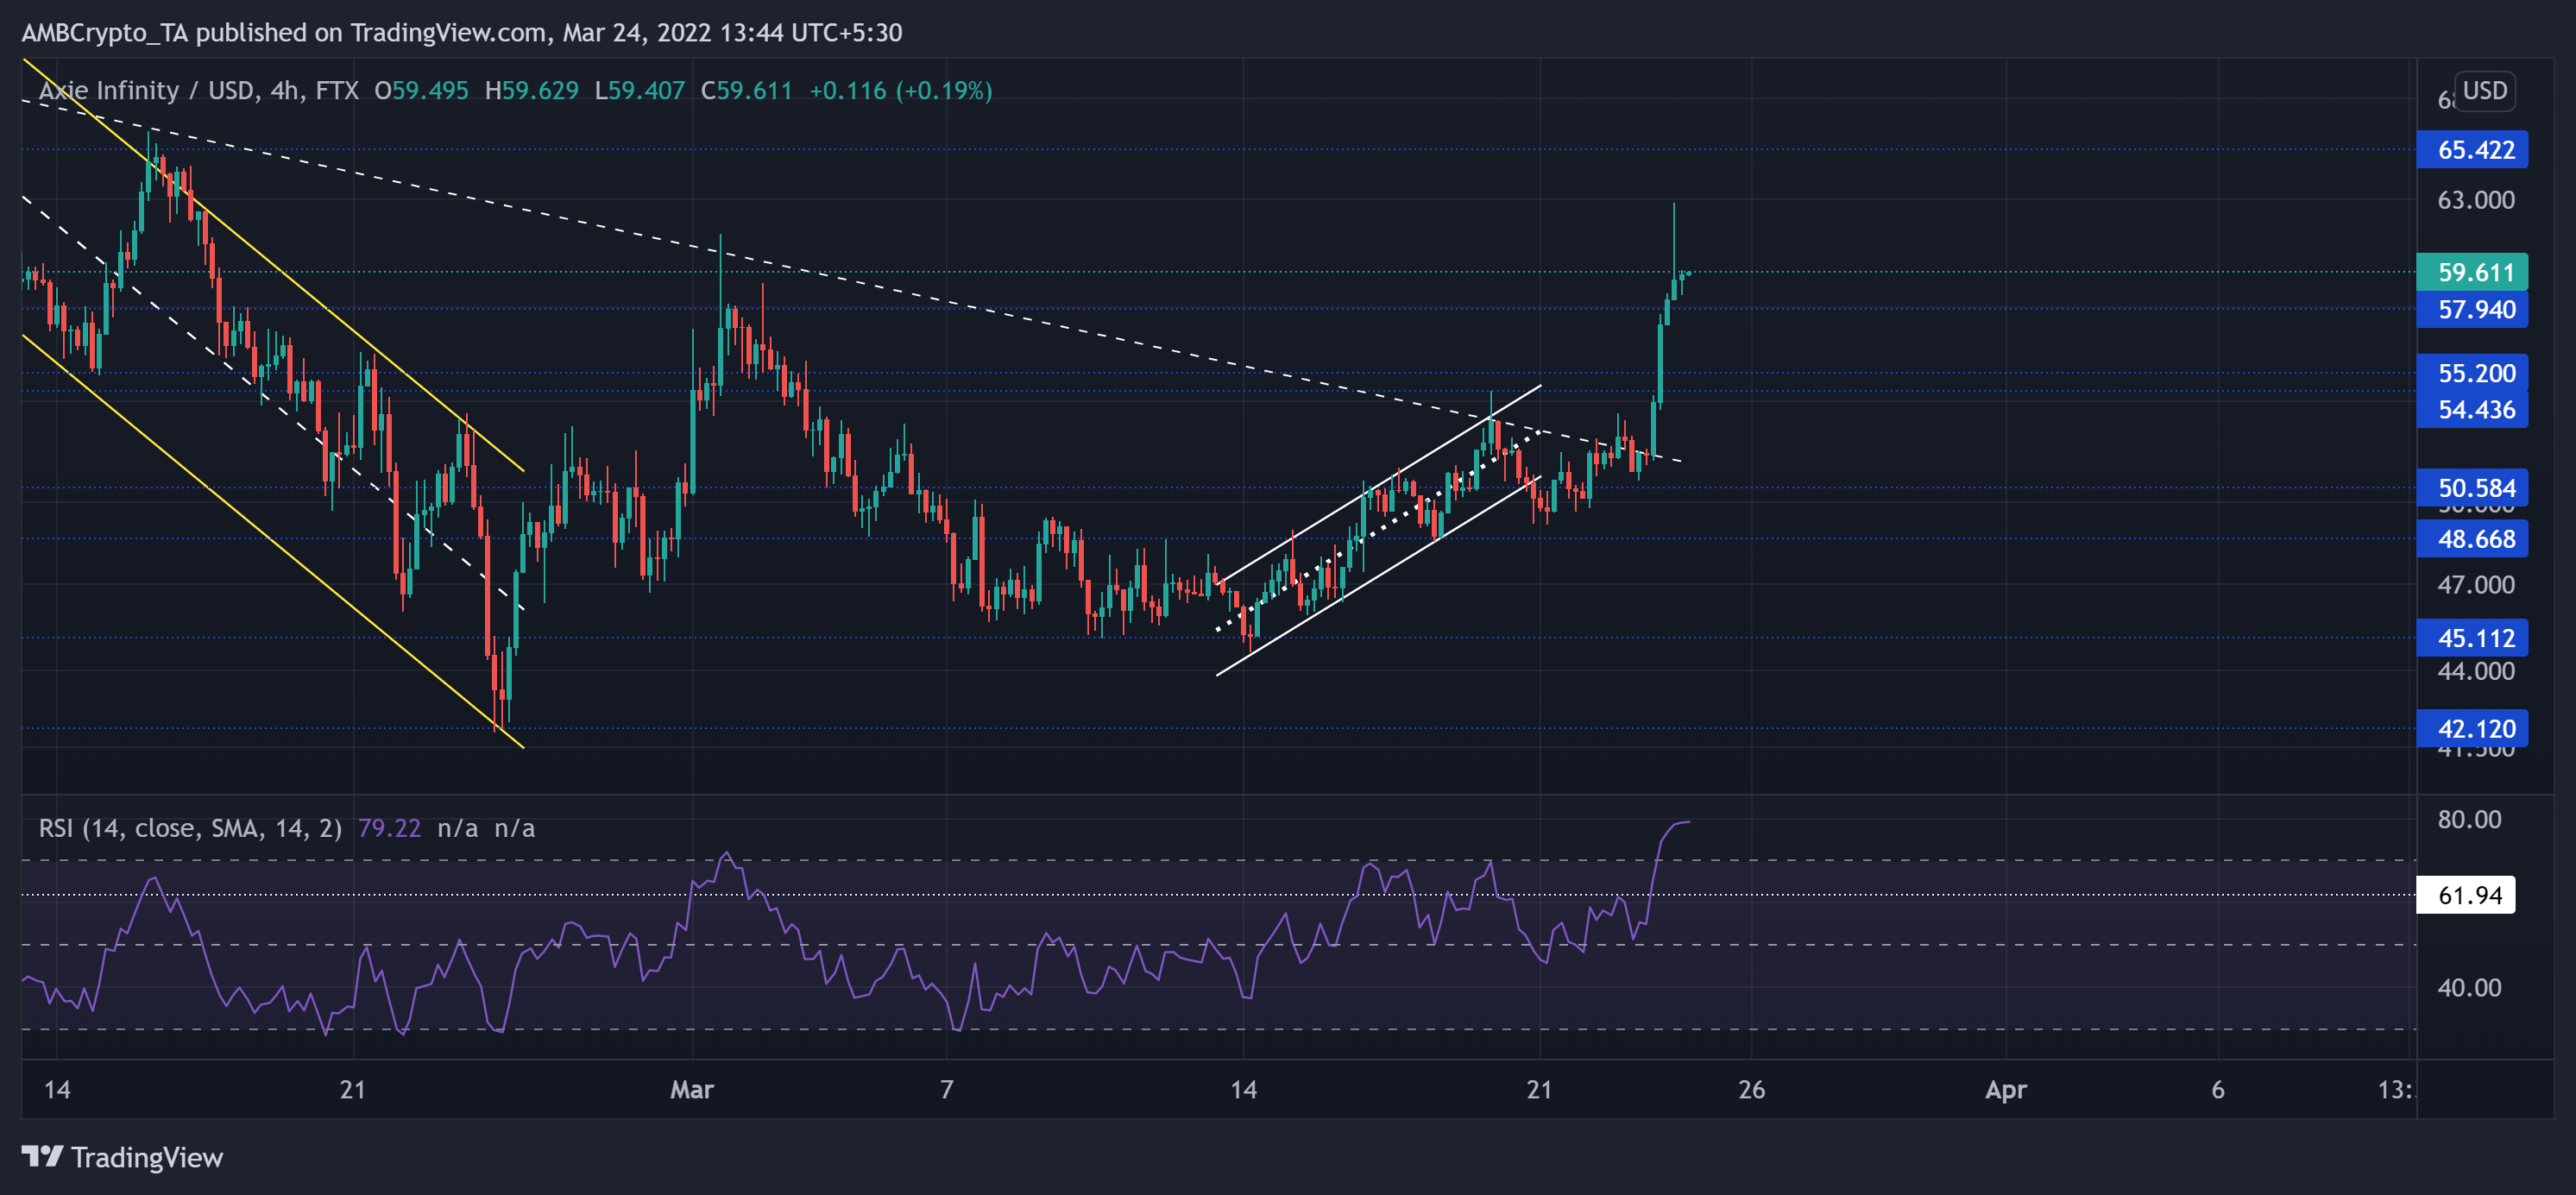
The retracement phase saw multiple down channels on its 4-hour chart as the alt lost nearly 74.4% of its value (Since its ATH). As a result, AXS touched its six-month low on 24 February.
During this fallout, the altcoin lost the critical $80-mark while the bulls kept the $42-base intact. Consequently, AXS has seen gradual recovery since. The latest rally marked an up-channel (white), one that faced a barrier at the two-month-long trendline resistance before the bulls breached it over the past day.
At press time, AXS traded at $59.611. The RSI was deep into the overbought territory and positioned itself for a near-term pullback. Now, as it touched its six-week high, any reversal from here could find testing grounds at the 61-mark.