TRON: Despite recent volatility, TRX’s bullish trend remains
A bullish phase was underway, but the swift retracement over the past couple of days could reset market sentiment.

- TRON had bullish momentum earlier this week, but lost it in the face of the bearish onslaught.
- A bullish phase had settled upon TRX, and did not signal an overextended market.
TRON [TRX] had succeeded in breaking out past the five-month range high at $0.274. In a report from early June, it was suggested that TRON lacked momentum and buying pressure and could struggle to break out.
Bitcoin’s [BTC] momentum had influenced the altcoin. BTC’s move toward $110k earlier this week prompted TRX to rally past $0.274.
The subsequent BTC drop to $103.8k at the time of writing meant that TRX bulls’ efforts were undone yet again.

The token was trading within its former range (purple) now. On the 10th of June, the CMF showed a reading of +0.08, a clue of sizable capital inflows and increased buying pressure.
The market-wide correction of the past couple of days saw the CMF drop below 0. The A/D indicator has lacked a strong trend, but did show a heightened selling volume since then.
The local support zone at $0.267 was likely to be tested once again. Whether TRON bulls defend this demand zone would depend on the market sentiment in the coming days and Bitcoin’s ability to stay above $100k.
Is TRX headed for a bullish phase?
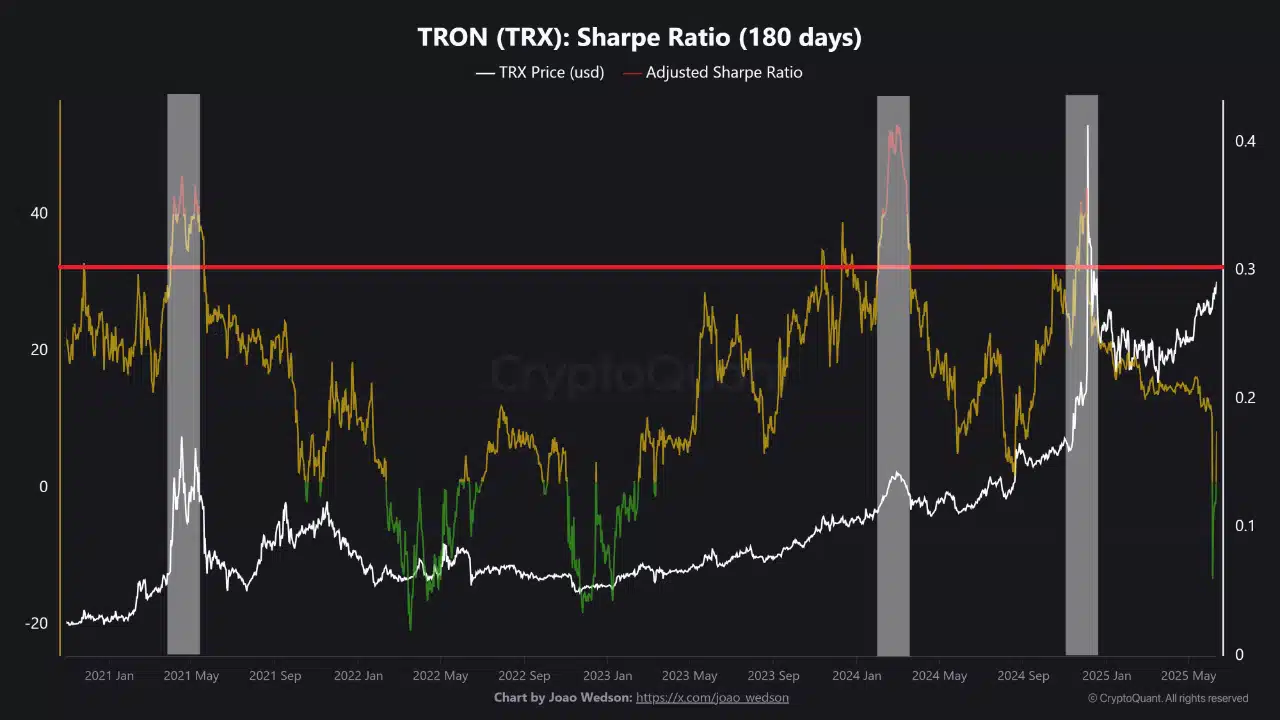
In a post on CryptoQuant Insights, analyst Burak Kesmeci observed that the Sharpe ratio, which could be used to identify cycle tops, showed that TRX was “still cheap.” The Sharpe Ratio measures risk-adjusted returns.
Values above 40 for the metric have signaled overheated market conditions. Meanwhile, 1.00 has been the pivot — when the Sharpe Ratio is above 1.00, a bullish phase would usually be in progress.
At the time of writing, the metric was at 8.36. It had dipped below 1 on the 7th of June, jumping back above it on the 11th of June.
Hence, it was a sign that bullish TRX price action could be expected, but that the market was not overextended.

The daily active addresses have been slowly rising since early 2024. It continued to trend higher, although it saw a sharp spike and an equally big reset on the 6th and the 7th of June.
This uptrend in 2025 indicated increased adoption and demand. The new address growth has been steady around the 200k-250k mark.