Tron, Ethereum Classic, Verge Analysis: 16 June

With Bitcoin‘s rally coming to a halt, most of the market’s altcoins have started moving sideways. While Verge consistently lost its 24-hour trading volumes to fall to $19.2 million, Tron continued to bask in its achievement of 39 million accounts. The upcoming Magneto hard fork upgrade, on the other hand, was keeping everyone talking about Ethereum Classic [ETC].
Tron [TRX]
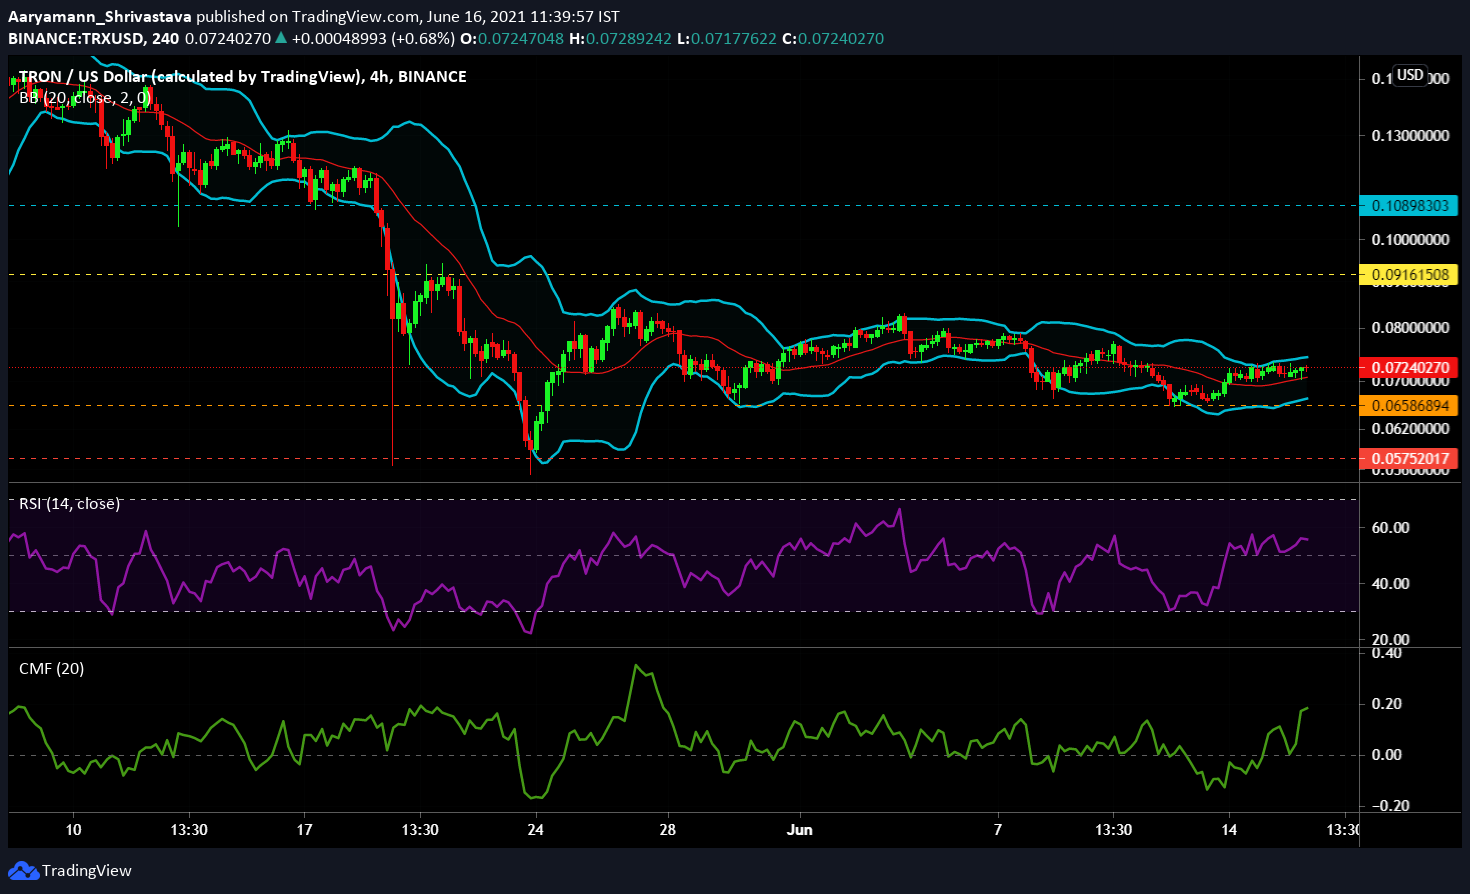
At press time, Tron could be observed trading in red at $0.072, even though the coin has been moving upwards for the last 3 days. TRX dragged itself close to the $0.065 support earlier on June 13, right before making a comeback. The Relative Strength Index (RSI) climbed back up from the oversold zone and could be seen fluctuating around the bullish neutral territory.
Although the Bollinger Bands seemed parallel, indicating no volatility for now, the basis remained in a support position for the coin. The Chaikin Money Flow reported high capital inflows as the indicator moved way above the neutral line to touch the 19.4-mark.
Due to the wide support and resistance ($0.091) range, the coin will continue to consolidate between it before going forward.
Ethereum Classic [ETC]
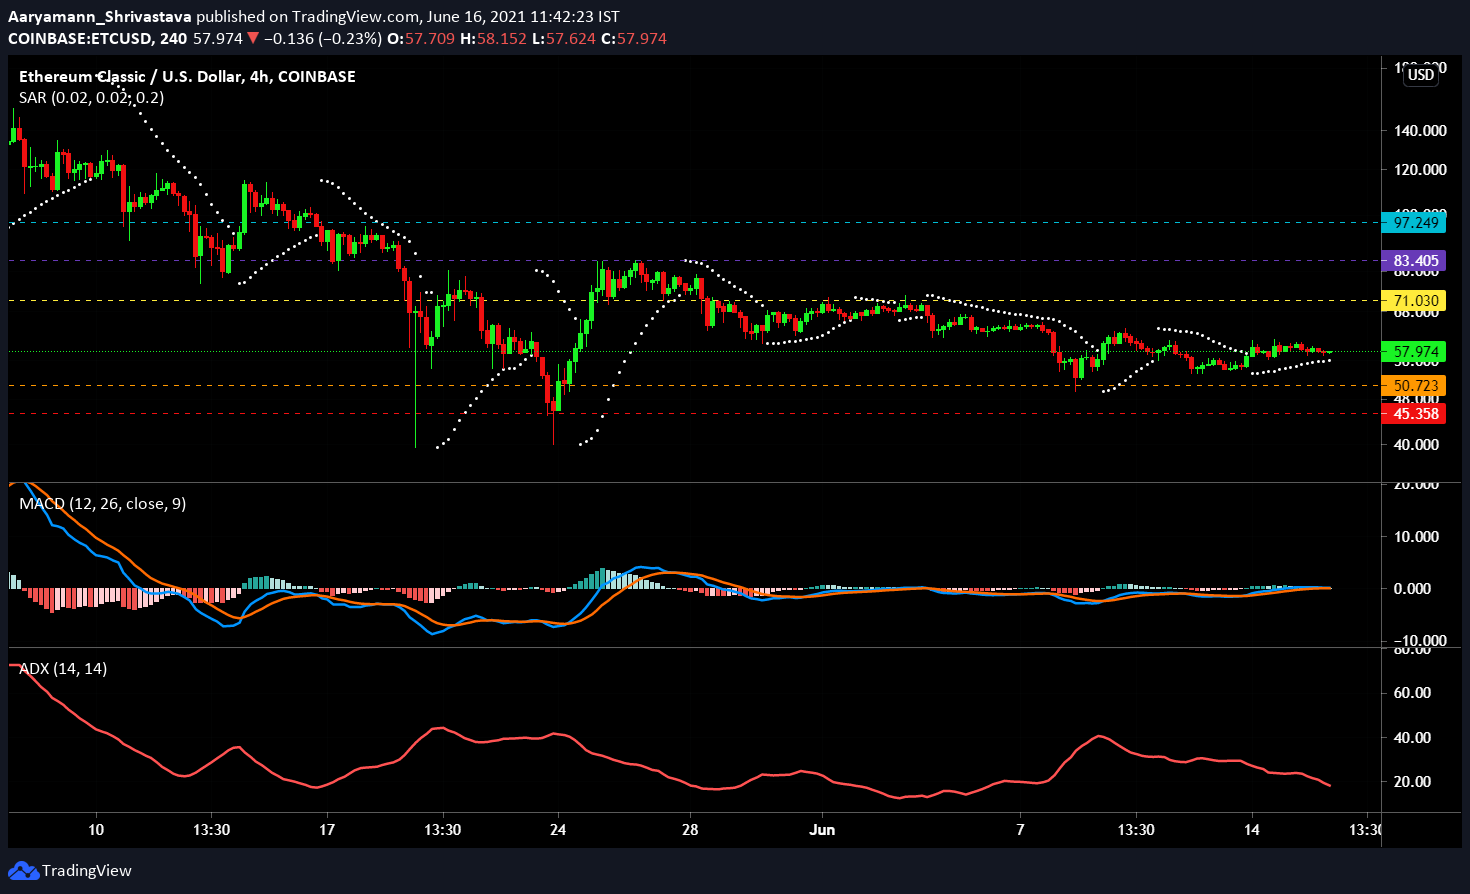
ETC’s movement has remained dormant for the last 24 hours. The coin continued to move sideways without any indication of sudden volatility, trading at $58 at press time. According to the MACD indicator, the blue indicator line and the red Signal line were both aligned right at the neutral line. This is for the better as the coin was previously trading close to the $50.72-support level.
The Parabolic SAR dictated an active uptrend given the presence of a white dotted line under the candlesticks. The uptrend was losing traction at the time of writing, however. This was in line with the Average Directional Index’s (ADX) movement. The red line indicator remained under 25, displaying a less directional trend in the market.
The coin continued to keep $50.7 and $71 as strong support and resistance levels, respectively.
Verge [XVG]
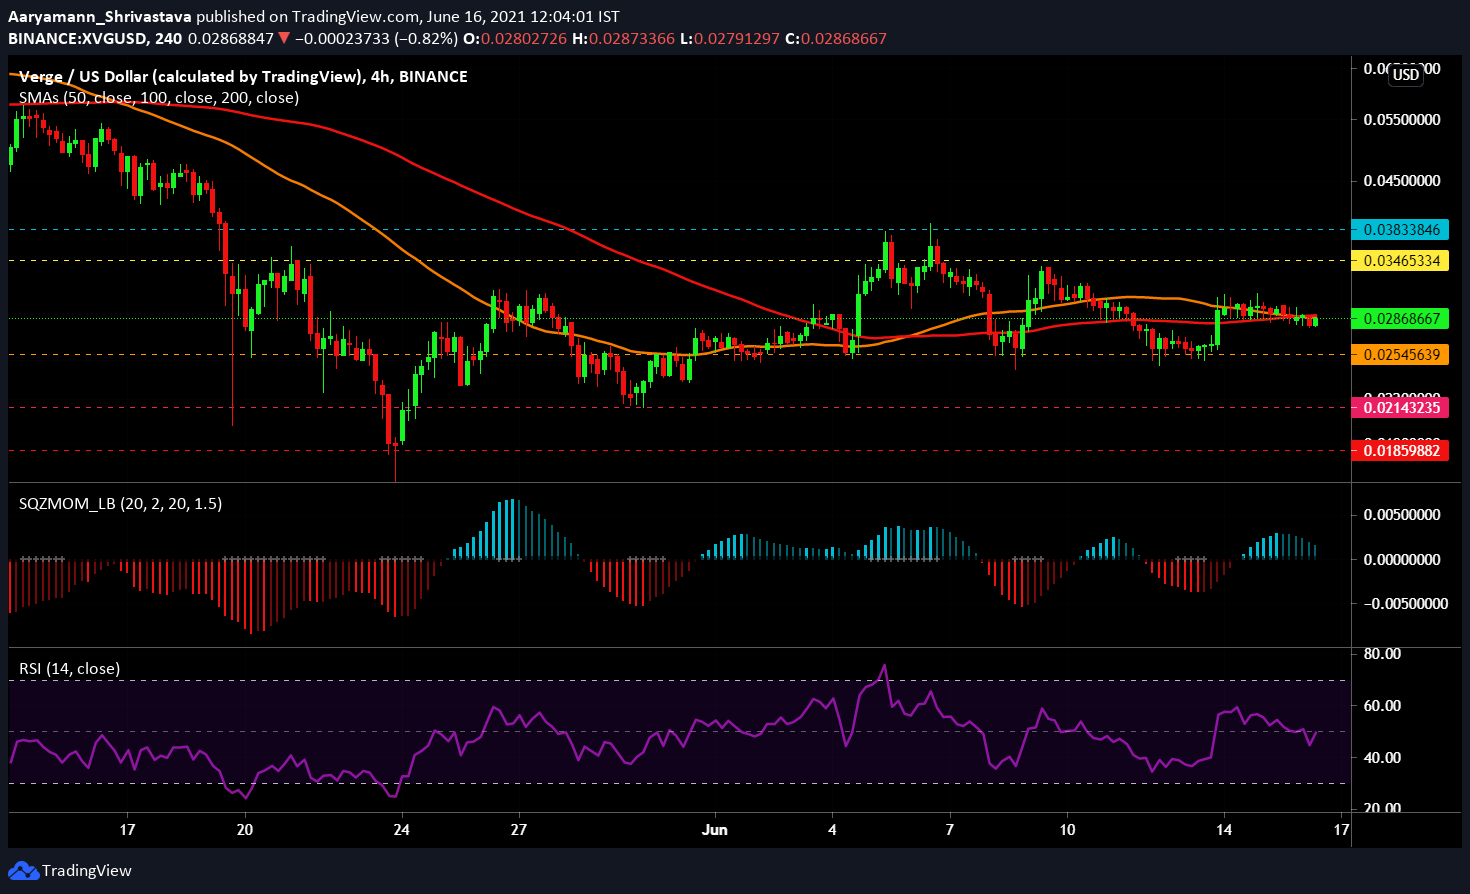
XVG has seen highly volatile movement since the beginning of June. Within the span of a week, the coin breached the $0.034-resistance, grazed the $0.038 critical resistance, and came back down to fluctuate around the $0.025-support level. At press time, XVG remained relatively less volatile as it steadily traded at $0.028. The Squeeze Momentum Indicator exhibited receding bullish pressure as the coin continued to remain in a squeeze (black dots).
Relative Strength Index (RSI) dipped under the neutral line into the bearish neutral territory over the last 24 hours, with a slight uptick visible at the time of writing. The Simple Moving Averages – 50 SMA (orange) and 100 SMA (red) were aligned, resting slightly above the candlesticks.
While the active support level is a key level, a fall below it will establish the next support at $0.021.