Altcoin

Tron investors have all the reasons to maintain caution this crypto winter
Posted:
| Last updated: January 13th, 2023
editors
- Tron’s Relative Strength Index (RSI) was overbought at press time
- TRX’s metrics and market indicators strongly favored the bears
Tron’s [TRX] price action of last week was extremely sluggish, as it registered negative growth. New data from CryptoQuant revealed that the upcoming days might be even worse, as TRX’s RSI was in an overbought position. This pointed towards a further decline in its price.
At the time of writing, TRX was down by more than 1% in the last 24 hours and was trading at $0.05328 with a market capitalization of more than $4.9 billion. However, TRX could witness a change in trend considering the last few developments.
Read Tron’s [TRX] Price Prediction 2023-2024
Where does Tron stand?
Last week, the Dominican government gave Tron an allowance to issue Dominica’s national token. This was an optimistic update as it reflected increased adoption of Tron on a global scale. Justin Sun, the founder of Tron, also joined the Reuters NEXT Leadership Summit online and gave multiple interviews on the theme of “crypto winter.”
?Check out #TRON Highlights from this week (Nov 26, 2022 – Dec 02, 2022).
?We'll update you on the main news about #TRON and #TRON #Ecosystem. So stay tuned, #TRONICS! pic.twitter.com/VDOylmFG3R
— TRON DAO (@trondao) December 3, 2022
Nonetheless, things did not seem to work in TRX’s favor on the metrics front. For instance, since the beginning of this month, Tron’s total value witnessed a downfall. Furthermore, Santiment’s chart revealed several more metrics that indicated a price fall.
For instance, TRX’s development activity went down over the last week. TRX’s volume also followed a similar path and declined. Additionally, TRX also failed to gain interest from the derivatives market as its Binance funding rate was consistently low.
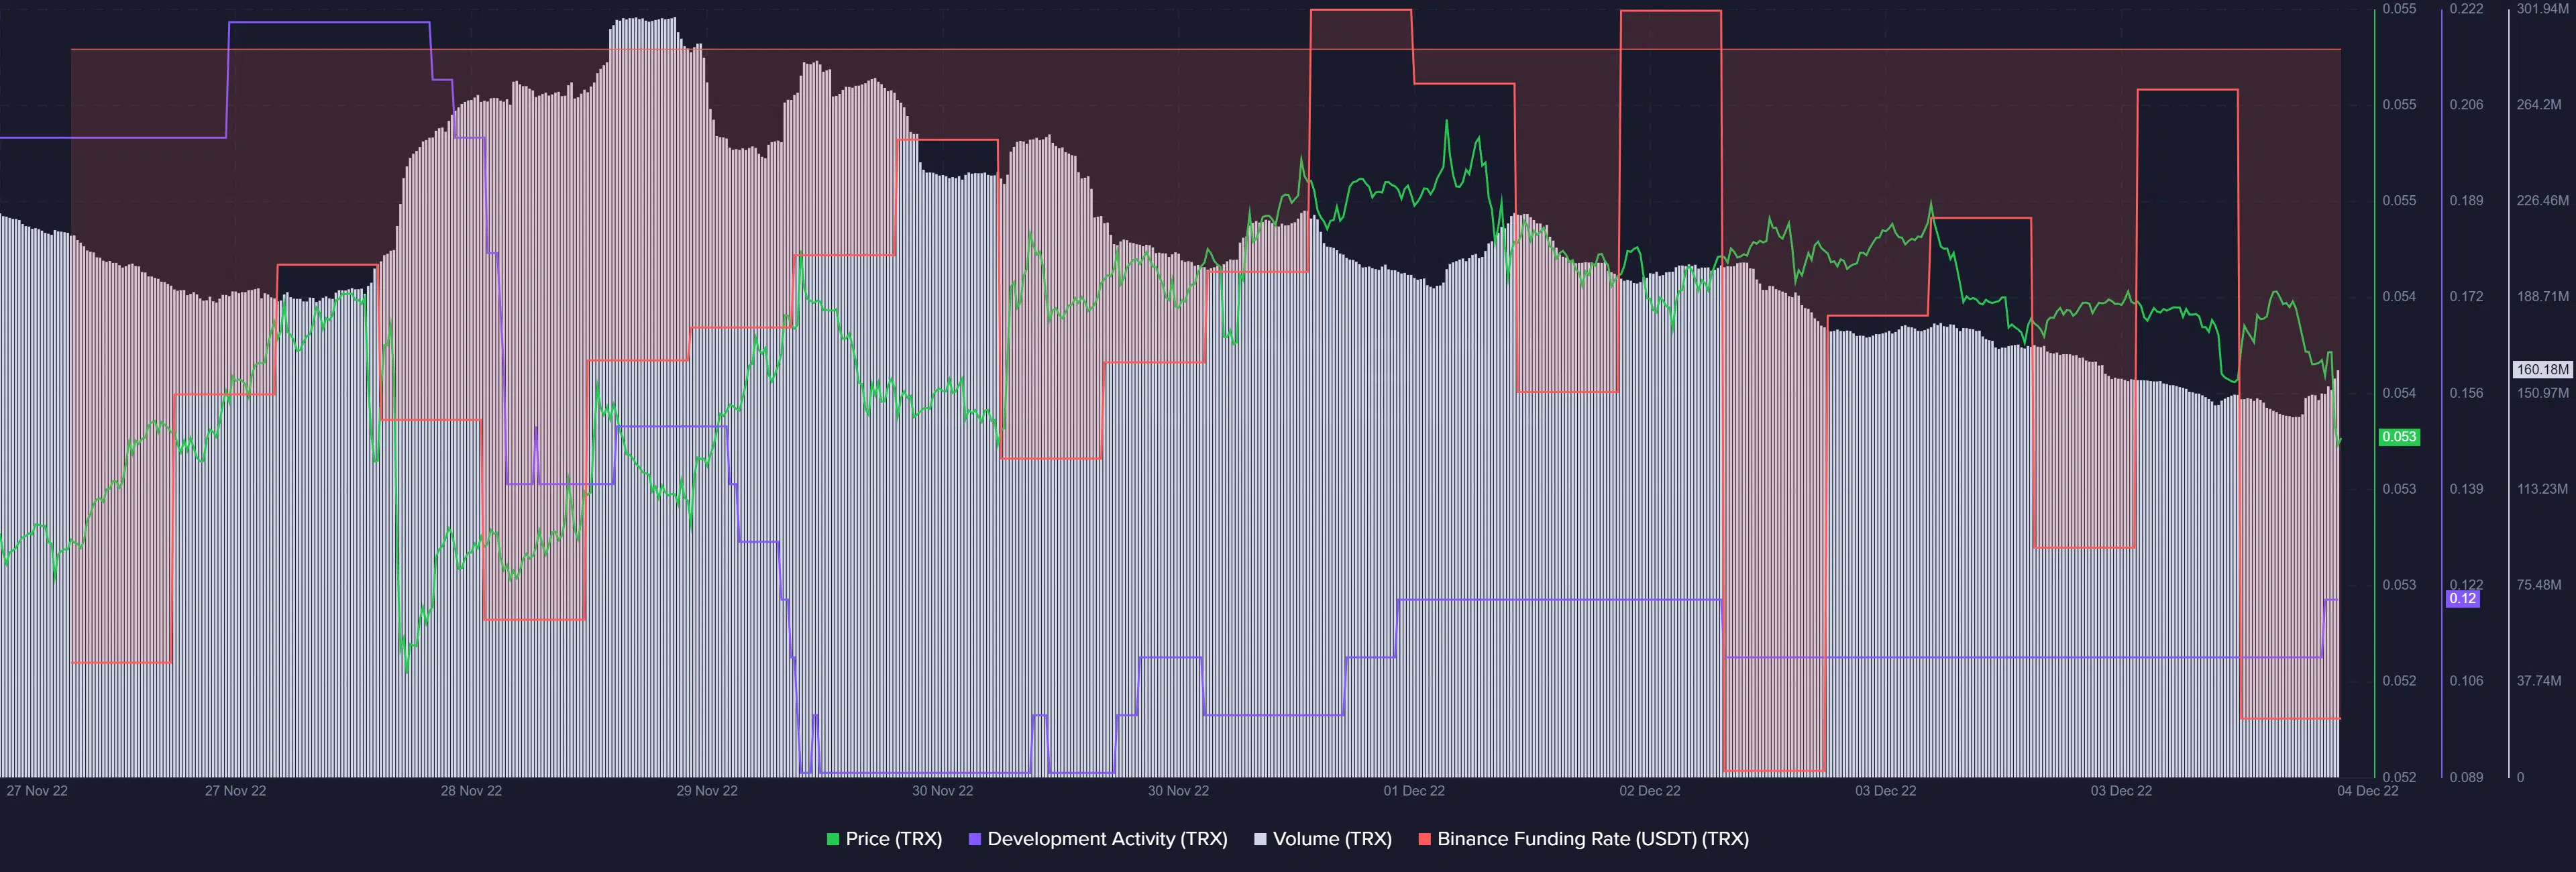
Source: Santiment
At the mercy of the bears
Not only the metrics, but quite a few market indicators also supported the bears. TRX’s Money Flow Index (MFI) was hovering around the overbought zone, which was a negative signal.
The 50-day Exponential Moving Average (EMA) (red) was also considerably above the 20-day EMA (green), further increasing the chances of a downtrend. However, the Moving Average Convergence Divergence (MACD) provided a much-needed relief as it revealed that the bulls still had the upper hand in the market.
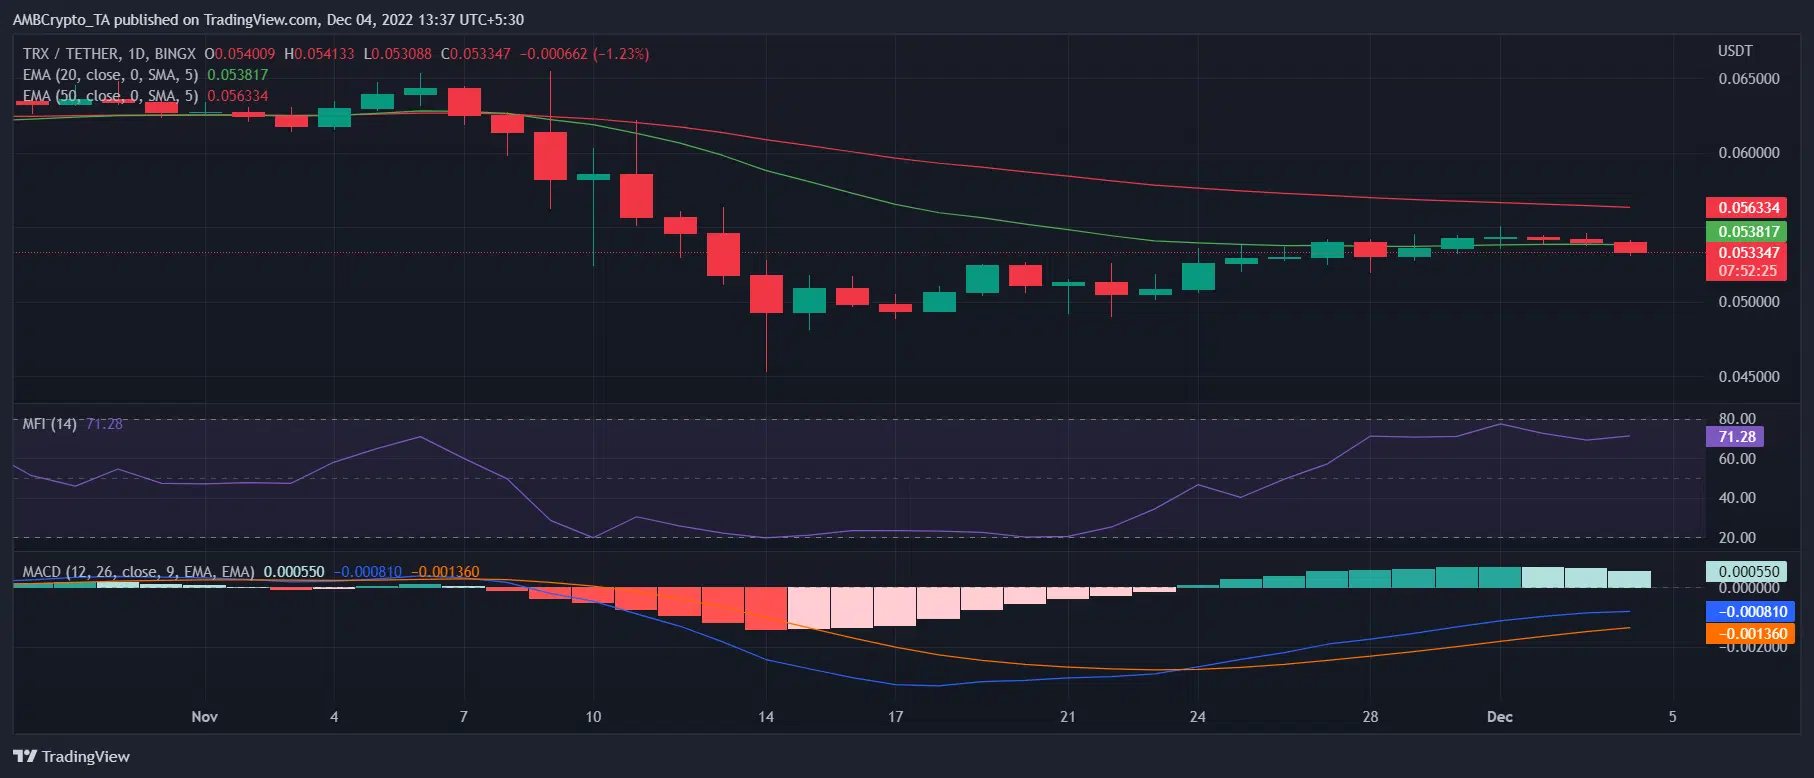
Source: TradingView


![Why Chainlink [LINK] and Polygon [MATIC] are more similar than you realise](https://ambcrypto.com/wp-content/uploads/2024/04/Chainlink_and_Polygon-1-400x240.webp)

