TRON offers traders these opportunities as the price forms a range

Disclaimer: The findings of the following analysis are the sole opinions of the writer and should not be considered investment advice.
Bitcoin, at press time, was trading at $31.5k, with the crypto having some support around $31.1k. The bullishness behind Bitcoin on the lower timeframes did not translate well across the market as BTC appeared to post more gains when compared to altcoins.
To support this idea, we can see the Bitcoin Dominance metric rise from 46.3% to 46.9% over the past three days. TRON has been trading within a range over the past week, and this range offered traders opportunities to position themselves long or spot. Or even accumulate TRX at the range lows.
TRX- 1 Hour Chart
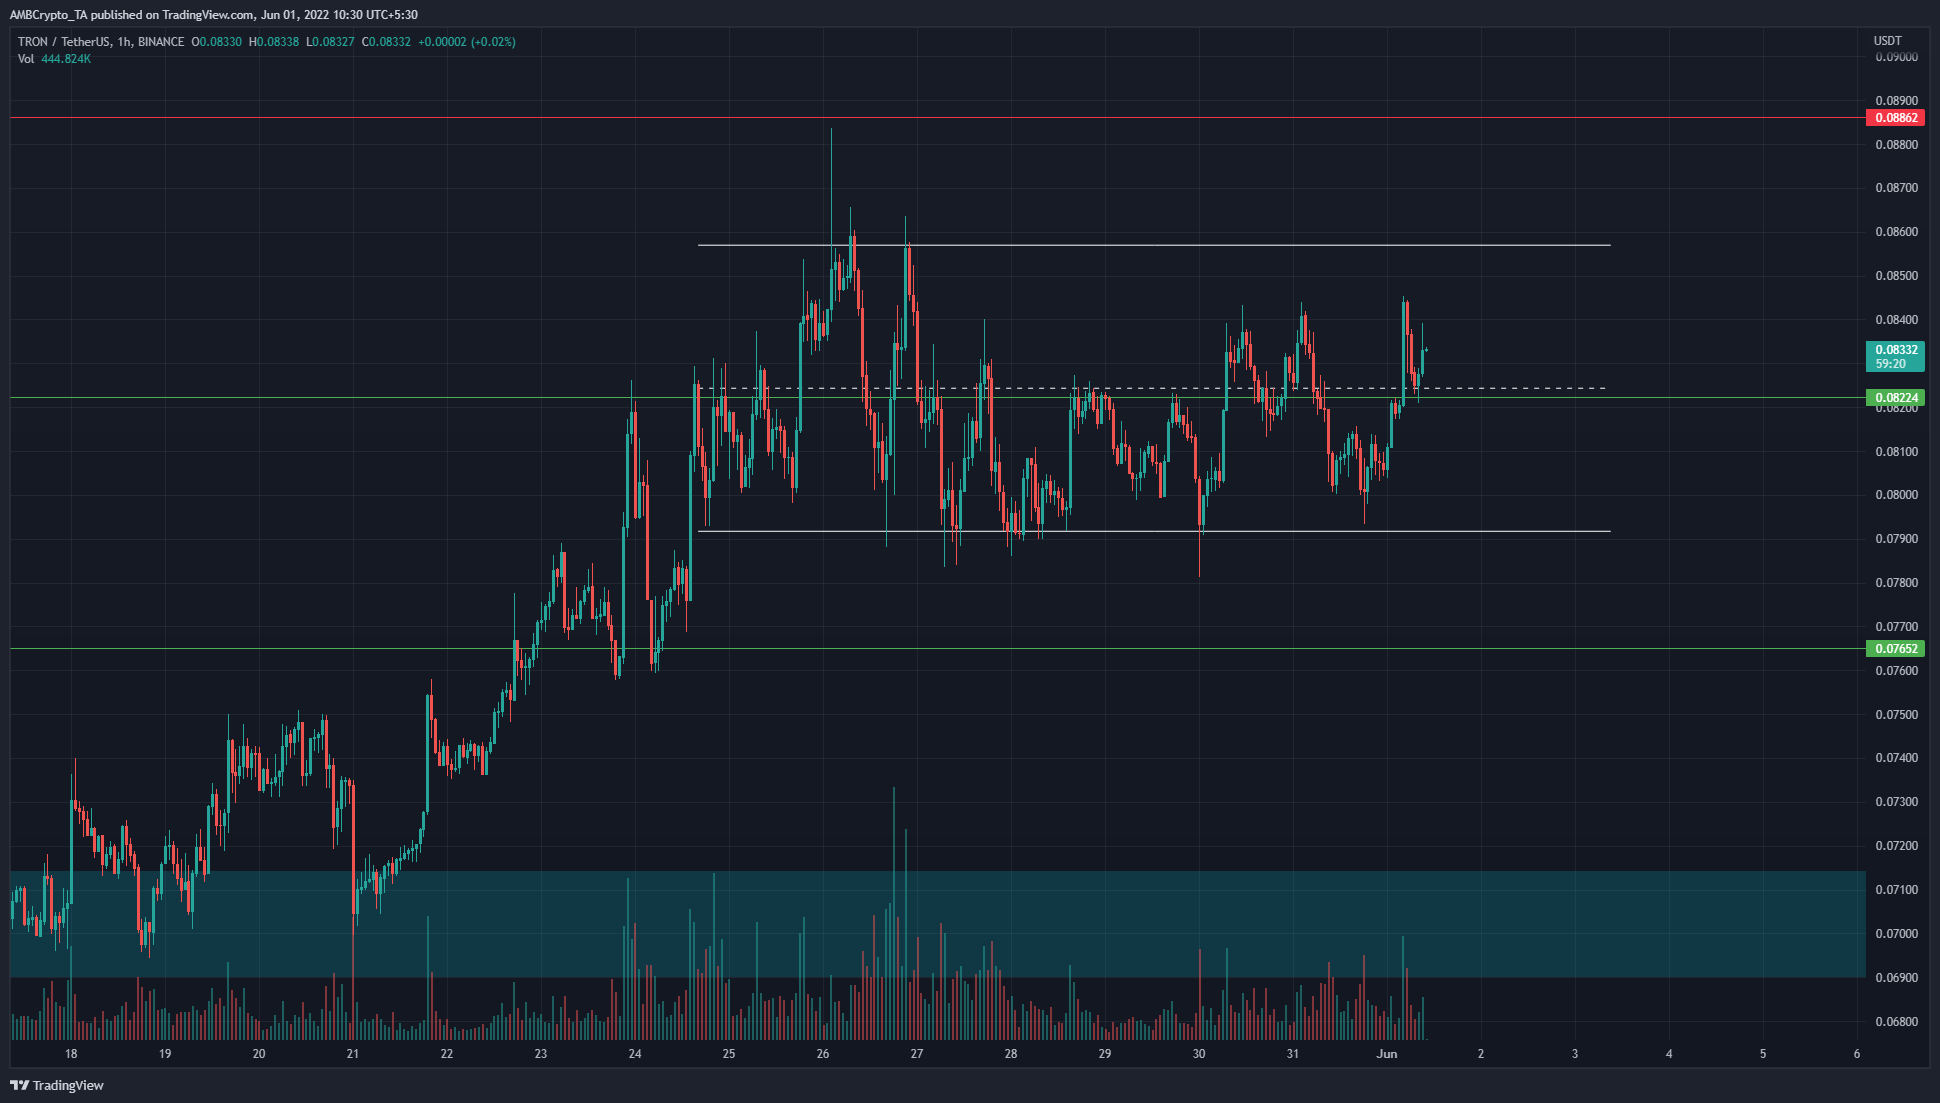
The $0.07-area (cyan) has been highlighted as a zone of demand and two weeks ago, this zone was defended by the bulls. Thereafter, a rally to $0.088 ensued, but the bulls were unable to hold on to their gains.
At the same time, the selling pressure was unable to push the prices beneath the $0.079-mark, and a range was established from $0.0791 to $0.0857. Traders can look to short the range highs, and long the range lows. Spot buyers can look to buy TRX at the range lows, with a stop-loss beneath $0.078 for buyers and $0.0866 for the sellers.
Rationale
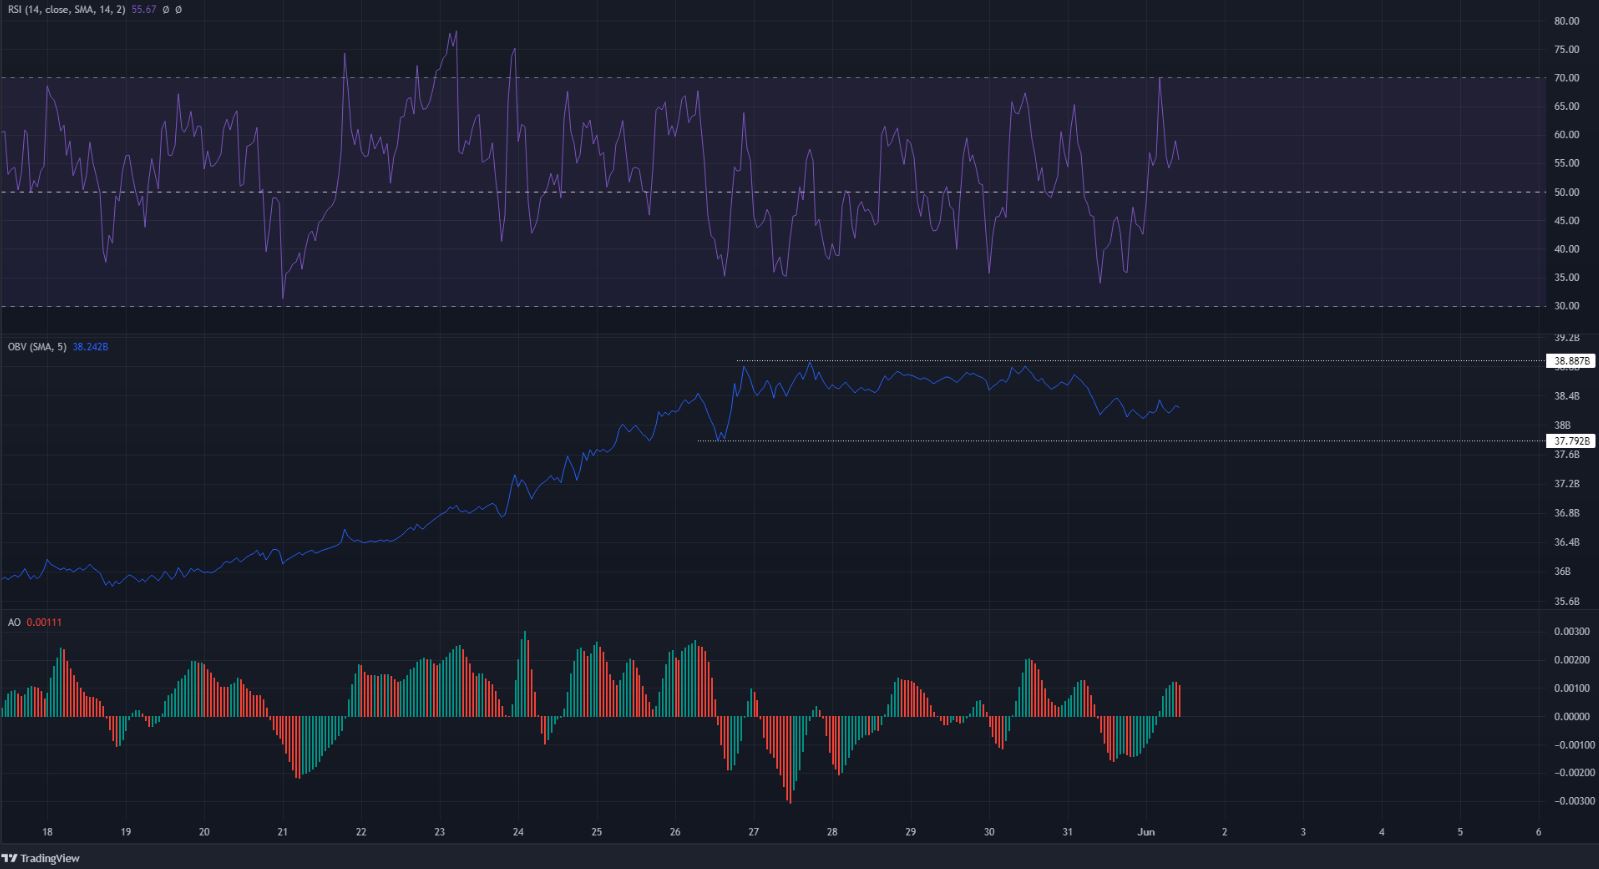
The RSI stood at 55 at press time to indicate that momentum was weakly bullish. However, the RSI has been oscillating between 35 and 65 over the past week to show that the trend is not in favor of either the bulls or the bears.
The Awesome Oscillator was also above the zero line over the past few hours of trading. However, within the past week, it too oscillated above and below the zero line to show that momentum has kept shifting.
The OBV also formed highs and lows over the past week, which it hasn’t breached in either direction yet.
Conclusion
The indicators agreed with the price action, and in the shorter timeframes, a trend is not yet present. Hence, the range lows and range highs are likely to offer directional trading opportunities.
A breakout on the OBV would likely precede a breakout on the price chart, and traders can keep an eye on the OBV as well.