Analysis
Tron Price Analysis: 29 March
Tron has moved to the 23rd position on CoinMarketCap’s list of cryptocurrencies in terms of its market capitalization which was at $4.55 billion. Although the coin has been returning 135% to its investors, the altcoin has been seeing great volatility in the market.
At the time of writing, TRX was trading at $0.0627, while being part of a bearish trend.
Tron 1-day Chart
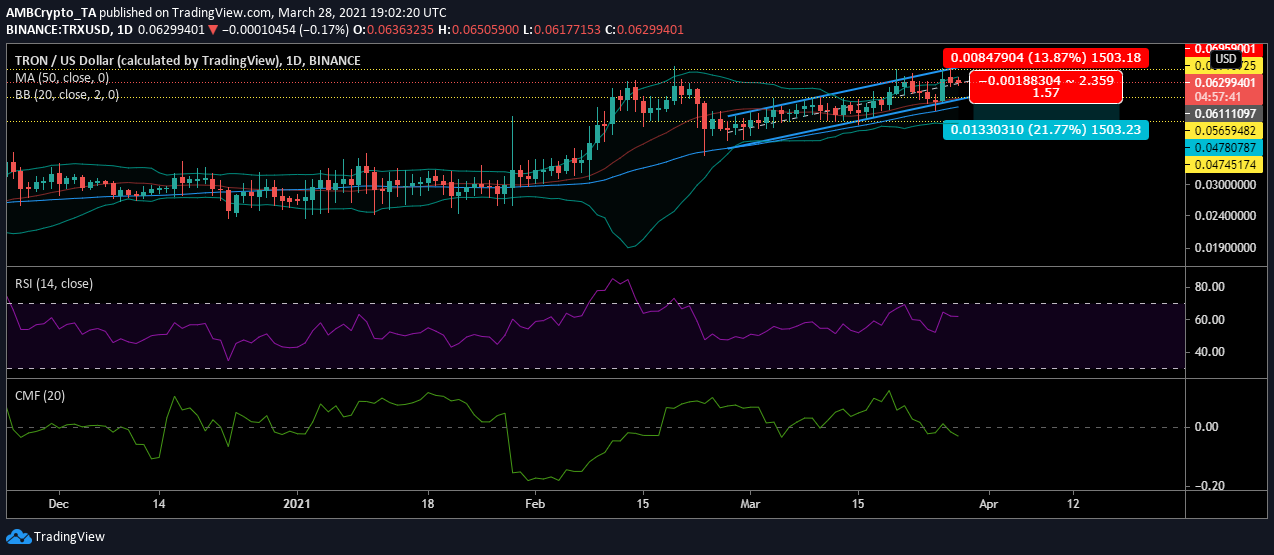
Source: TRXUSD on TradingView
Tron was forming a sharp ascending channel as its price has been escalating higher since the end of February. The cryptocurrency was breached levels of resistances to hit $0.0691, after which it has been seeing the value fall towards the support at $0.0565.
As the price heads lower, a break from the ascending channel may push the price lower, as more sellers enter the market.
Reasoning
The Bollinger Bands were diverging which was a sign of increasing volatility. The moving average may render some support, but the price may not be able to hold on to this level.
The Relative Strength Index was noting that his upwards movement of the digital asset hit the overbought zone recently. However, it reversed from this point and dropped. Tron has since remained close to the overbought zone which may suggest the asset may witness a trend change.
Meanwhile, the Chaikin Money Flow was affirming that money was flowing into the market however since then the money has begun to flow out of the market and this may result in the price undergoing a further drop.
Crucial levels
Entry-level: $0.0611
Take profit: $0.0478
Stop-level: $0.06959
Risk to Reward: 1.57
Conclusion
The Tron market has turned a little unstable as the price hit its resistance. The price may falter and fall to its next support at $0.0474 and the traders may get a chance to profit from a short-positon.