TRON sees a relief rally; here’s what traders should know

Disclaimer: The findings of the following analysis are the sole opinions of the writer and should not be considered investment advice
Bitcoin saw a bounce from $39.3k to $41.4k and posted some losses in recent hours to trade at $41.1k at the time of writing. TRON also reflected this minor bounce of Bitcoin on its own price charts.
In the next few hours, it appeared likely that TRON would be headed lower. Lower timeframe traders can have a legitimate doubt, though- is TRX still on its former downtrend, or has the price established a range between the $0.057 and $0.0623 levels?
TRX- 1 Hour Chart
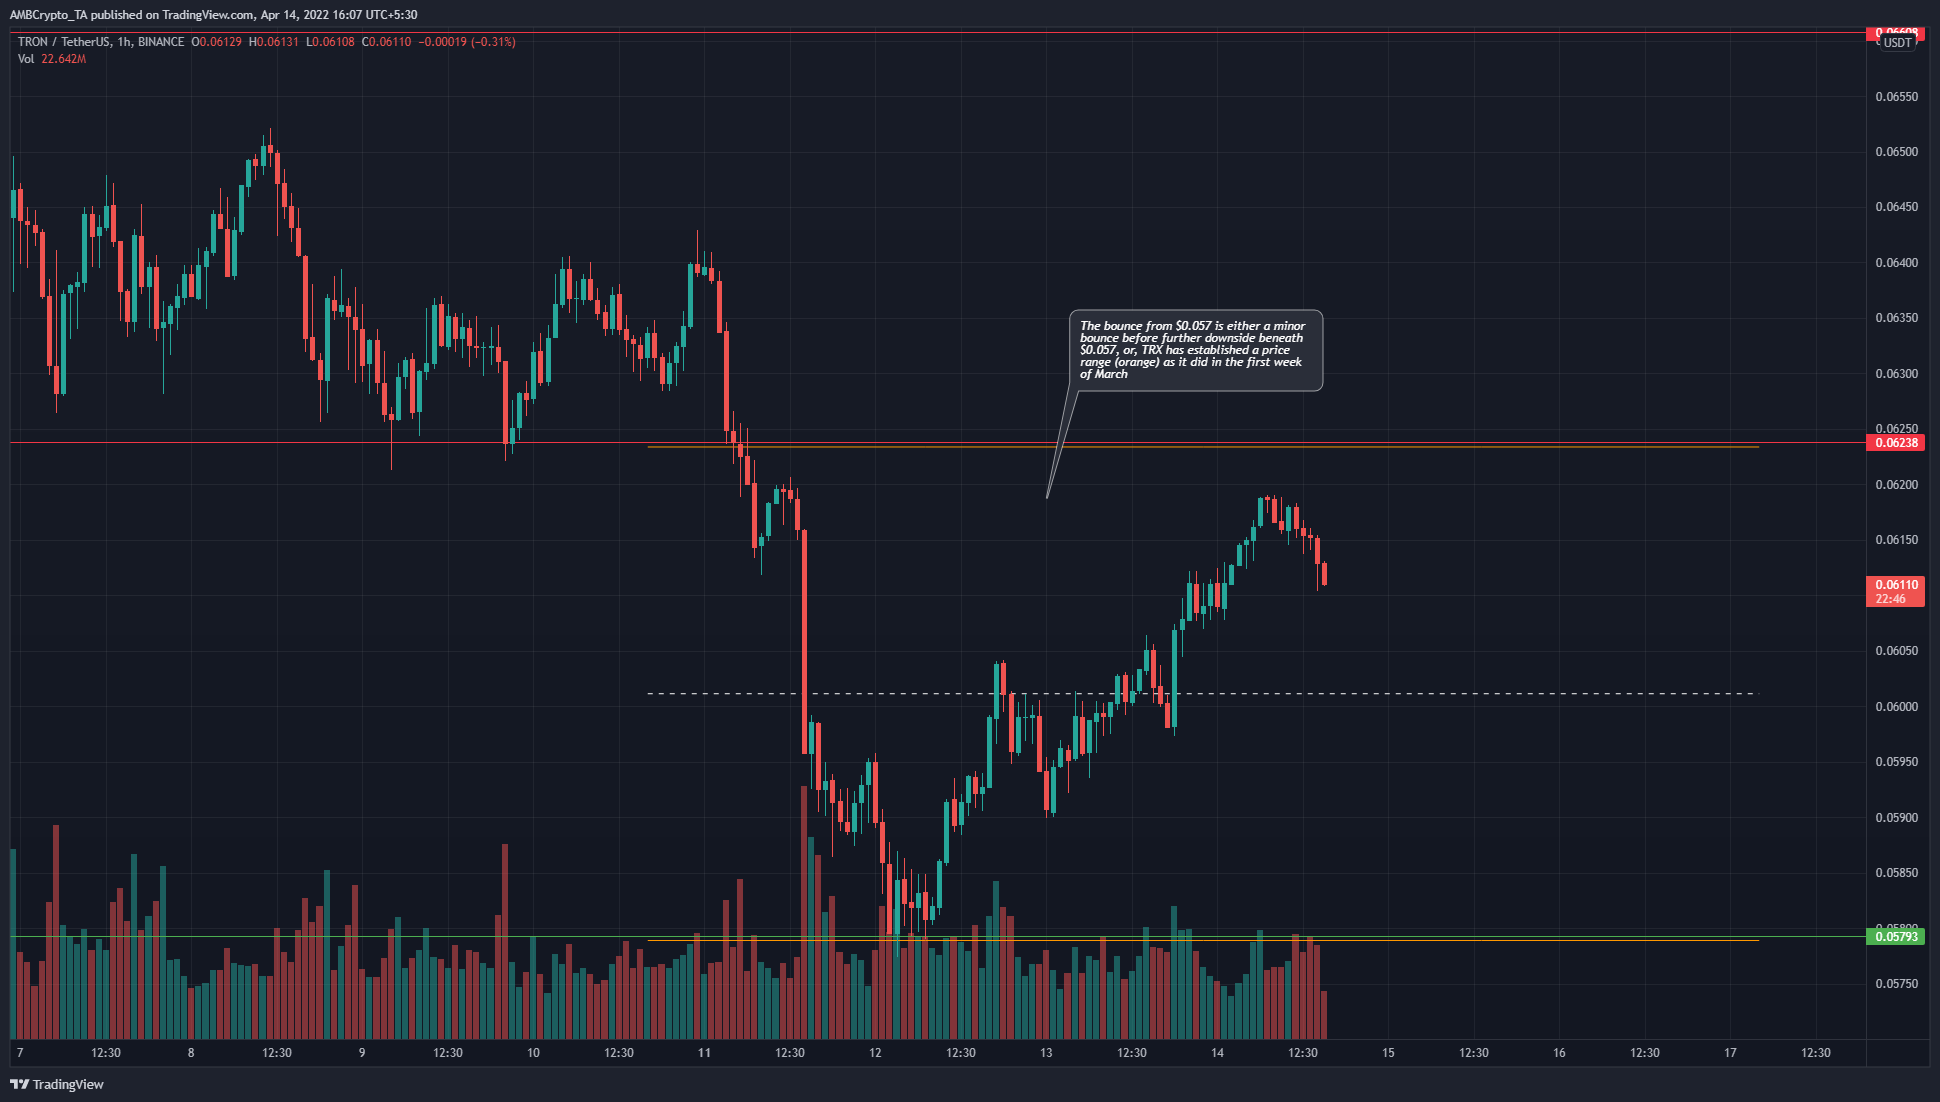
On the hourly chart, TRX saw a bounce from a long-term horizontal support level at $0.057. This had been the same level that had served as solid support for the price in the first week of the previous month.
In March, after a few days of consolidation within a range from $0.057-$0.062, demand stepped in to drive the prices to break out of the consolidation and reach $0.079 highs. In the past two weeks, the price has been trending lower on the charts.
Hence, this bounce from $0.057 could be a minor bounce before a renewed push lower by the bears. Alternatively, TRX is attempting to establish a range, within which it could see some accumulation before another expansion toward the north.
Rationale
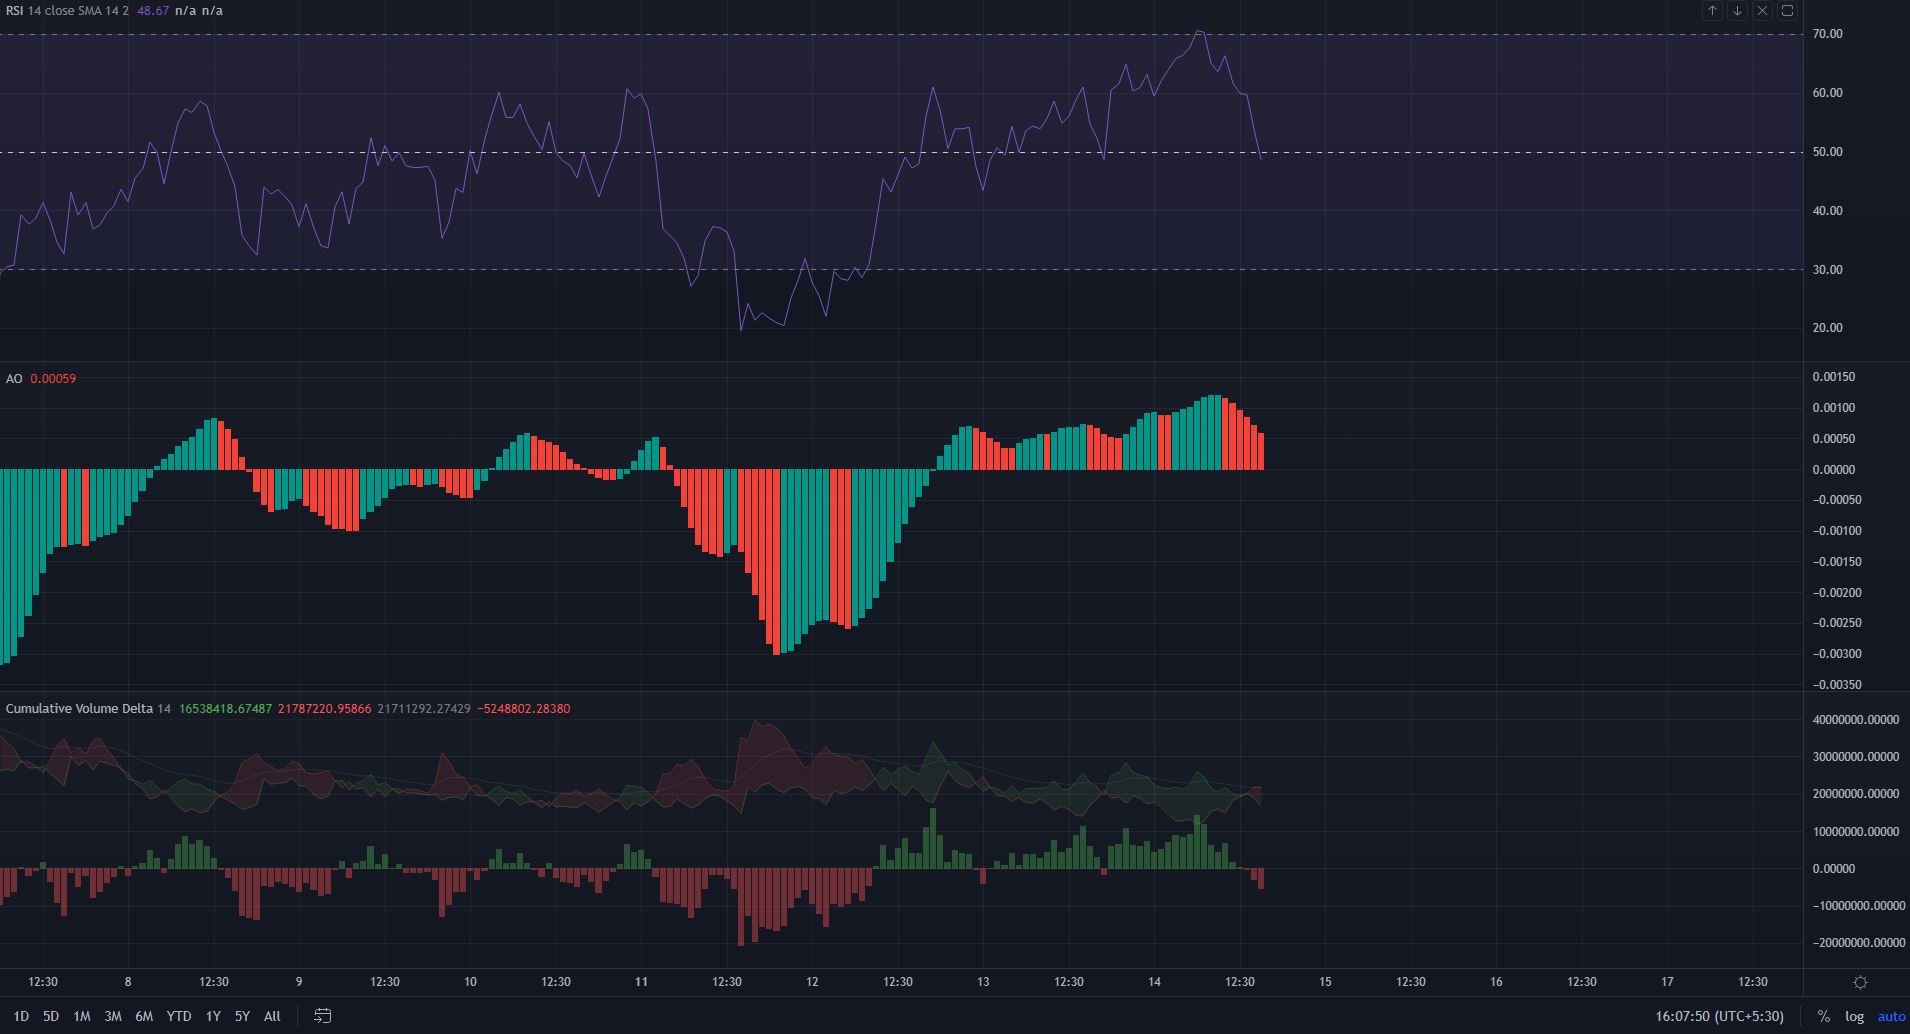
The RSI climbed above neutral 50 to denote bullish momentum a couple of days ago when the price was also successful in climbing above the $0.06 mark. At press time, the RSI was back at the neutral 50 line. In the next few hours, if it drops below 40, a move toward $0.057 could materialize.
The Awesome Oscillator also reflected the bullish movement of the past two days but has registered red bars on its histogram to show waning momentum. The CVD also slipped into the bearish territory to show rising selling pressure.
Conclusion
If TRX slips beneath $0.06 once more, it was likely to continue at least as low as $0.057. However, it remains to be seen if the support level can hold on the next time the bears come knocking.


