TRON vs. Cardano: Will TRX overtake ADA’s $23B market cap?

- TRX has shown notable growth, with its market cap surpassing $20 billion in December 2024, setting a new all-time high.
- If the market trends downward, ADA is at a higher risk of losing this support compared to TRX.
TRON [TRX] continues to gain traction, nearing Cardano [ADA] in market capitalization, with a current valuation of approximately $22 billion.
A 4% weekly gain and a 33% surge in trading volume signal growing investor interest and heightened network activity. If this trend holds, can TRX close the gap and secure its spot among the top blockchain networks?
Support levels at risk: TRX holds stronger than ADA
Bitcoin had its worst Q1 in seven years, ending 11% down from its New Year opening price. The altcoin market wasn’t spared, with both TRX and ADA trading far below their highs and losing key support levels.
AMBCrypto’s analysis shows a striking trend: TRX shed $14 billion in market value since Q4 last year, while ADA lost over $20 billion in the same time.
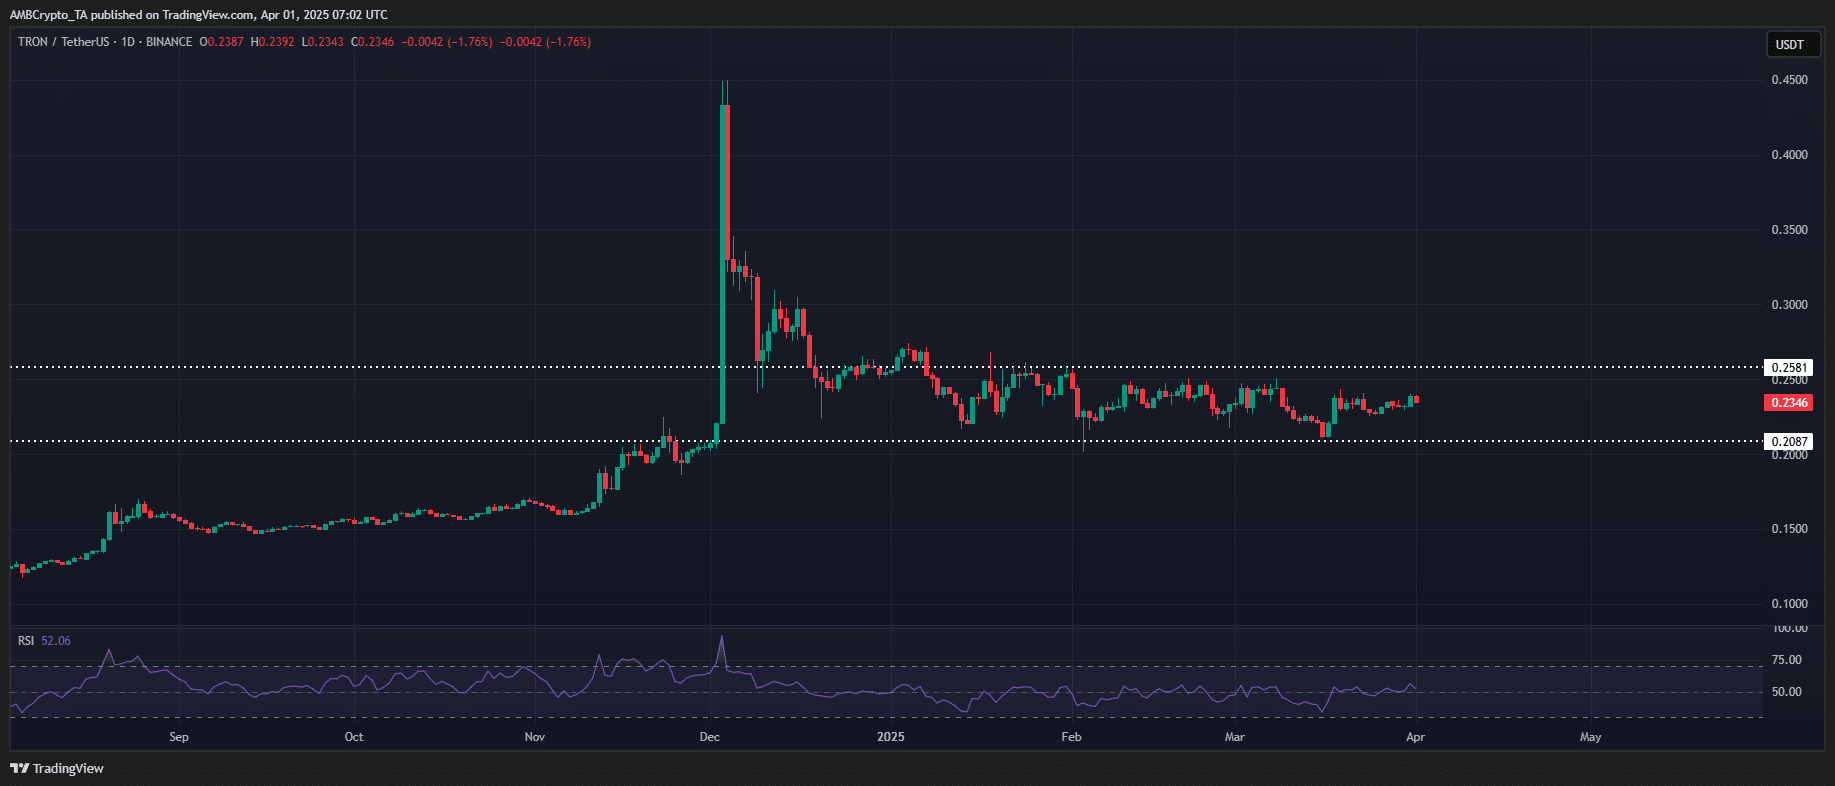
In short, ADA’s struggles have brought it closer to TRX. In fact, if Tron’s five-month consolidation leads to a breakout when the market recovers, overtaking Cardano could become a real possibility.
Since its December peak of $0.44, TRX has been stuck around $0.20, which it has tested four times.
ADA, on the other hand, is holding strong at $0.60, but it’s only tested this level twice. If the market dips further, ADA is more likely to lose its support than TRX.
The derivatives market highlights notable differences between Cardano and Tron. According to Coinglass data , Cardano leads in high-risk futures trading with an Open Interest (OI) of $766 million, a decline from $1.12 billion earlier this year.
In contrast, TRX has significantly lower speculative activity, with an OI of $195 million, making it less susceptible to major liquidations. Over the past 24 hours, more than $2 million in ADA longs were liquidated, compared to only $57.7k in TRX.
In bullish markets, Cardano’s strong presence in derivatives could drive its price higher than Tron’s. However, in bearish conditions, ADA is more vulnerable to steep liquidations, while TRX is likely to remain more stable.
This supports AMBCrypto’s earlier observation that Cardano is more likely than Tron to lose key support levels.
Beyond speculation: What the data tells us?
The on-chain metrics over the past year show some key differences. Cardano’s struggle to reclaim the $1 mark is backed by a significant -42.6% year-on-year drop in daily active addresses, now at just 23,477.
Meanwhile, TRX has seen a 53.1% surge in active addresses, reaching 2.6 million. This growth extends across other key metrics.
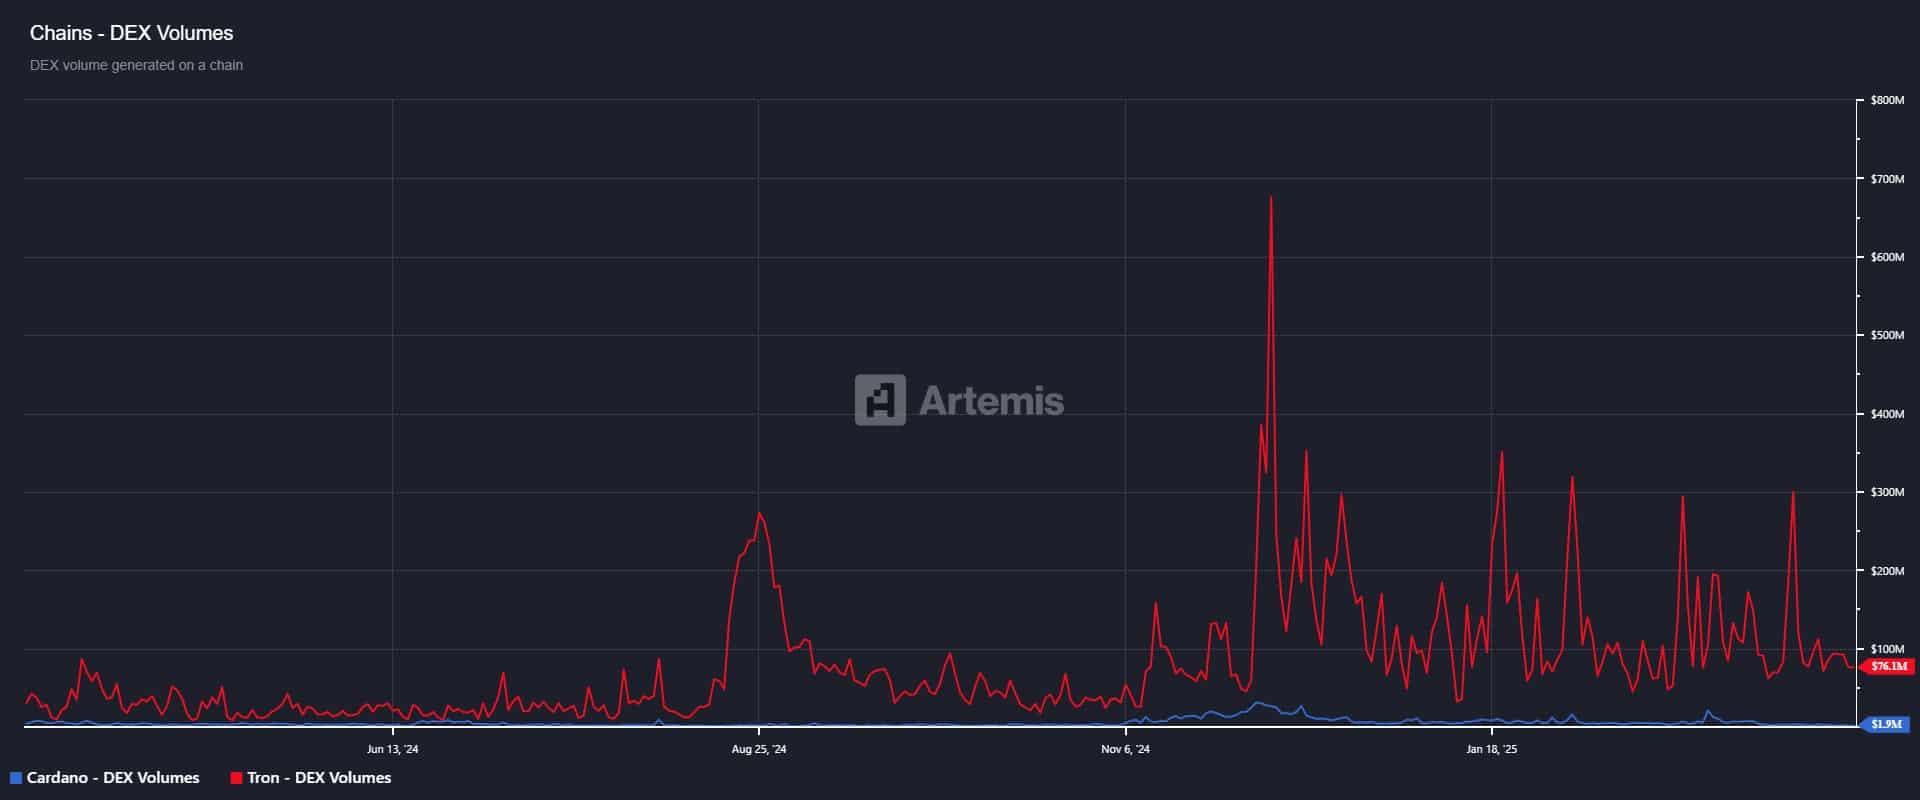
For instance, TRX has crossed the 1 million mark in fee generation, a stark difference from ADA’s 8.9k. Despite a dip in DEX volume, TRX still dominates with 76.1 million, leaving Cardano’s 1.9 million far behind.
Overall, these metrics suggest TRON is far outperforming Cardano in terms of network activity and adoption. With this momentum, TRON has a solid chance of surpassing Cardano’s $23 billion market cap.


