Tron, Waves, FTX Token Price Analysis: 24 December

Bitcoin’s correction was a drag on the broader market and it saw altcoins like Tron, Waves, and FTX Token move lower on the charts. While Tron and Waves seemed to have been drastically affected by Bitcoin’s movement, FTT’s daily loss was minimal compared to the other two.
Tron [TRX]
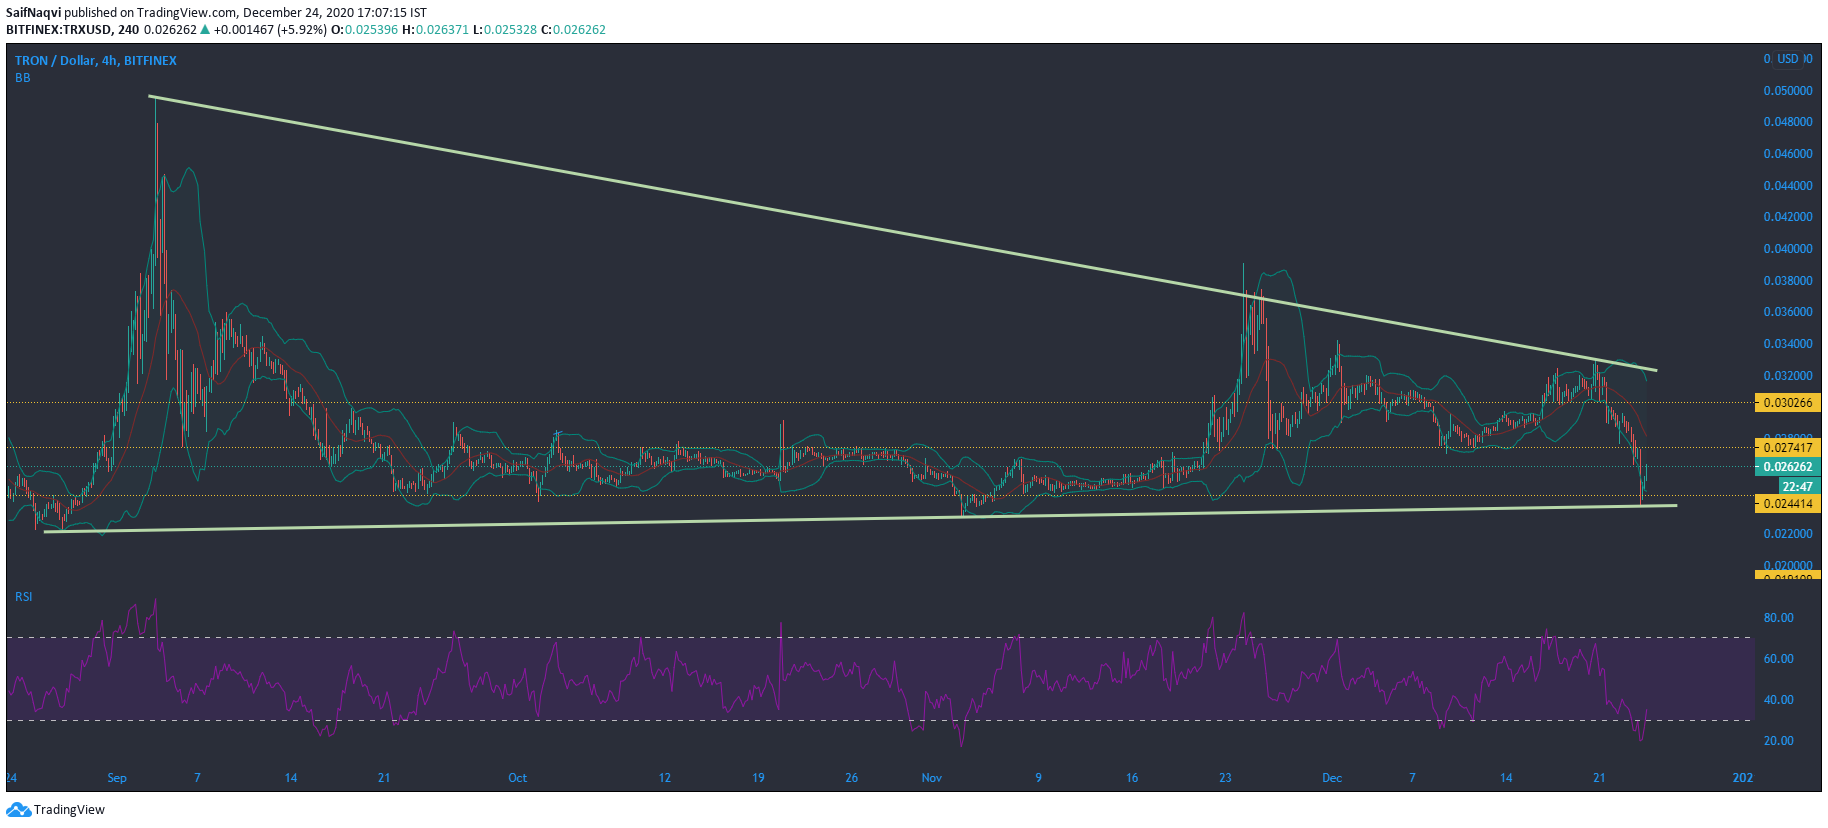
Tron’s price has been under pressure over the past week. After climbing above its resistance at $0.03, the Ethereum rival struggled to maintain upward momentum. In fact, Tron tumbled by 27.55% ever since it breached its resistance barrier. However, the last couple of sessions saw the crypto’s price move upwards once again, something that indicated that a reversal could be on the cards. If the price did rise, resistance at $0.027 could be tested.
The Bollinger Bands expanded further over the last 24 hours and showed increasing volatility for TRX. Although the indicator showed signs of bearishness, a bullish bounce could take place as the prices were trading on the lower band.
The Relative Strength Index saw upward momentum after trading in the oversold zone, suggesting that buyers could regain control of the market.
Waves [WAVES]

Like Tron, Waves has also come under pressure over the last week. In fact, its woes began in early December after its price breached the resistance at $8.90. Since then, the crypto’s price has fallen below several support levels, with the cryptocurrency down by over 40% in the last 16 days.
At the time of writing, it was trading close to its support at $5.43. However, the last few sessions did see a slight uptick in price and suggested that a move upwards could be possible in the short-term. If the price does rise, it could meet the resistance at $7.15
The Chaikin Money Flow showed that capital was moving back into the crypto-asset after outflows were noted over the past week.
The On Balance Volume registered an uptick, hinting at the renewed interest in WAVES.
FTX Token [FTT]
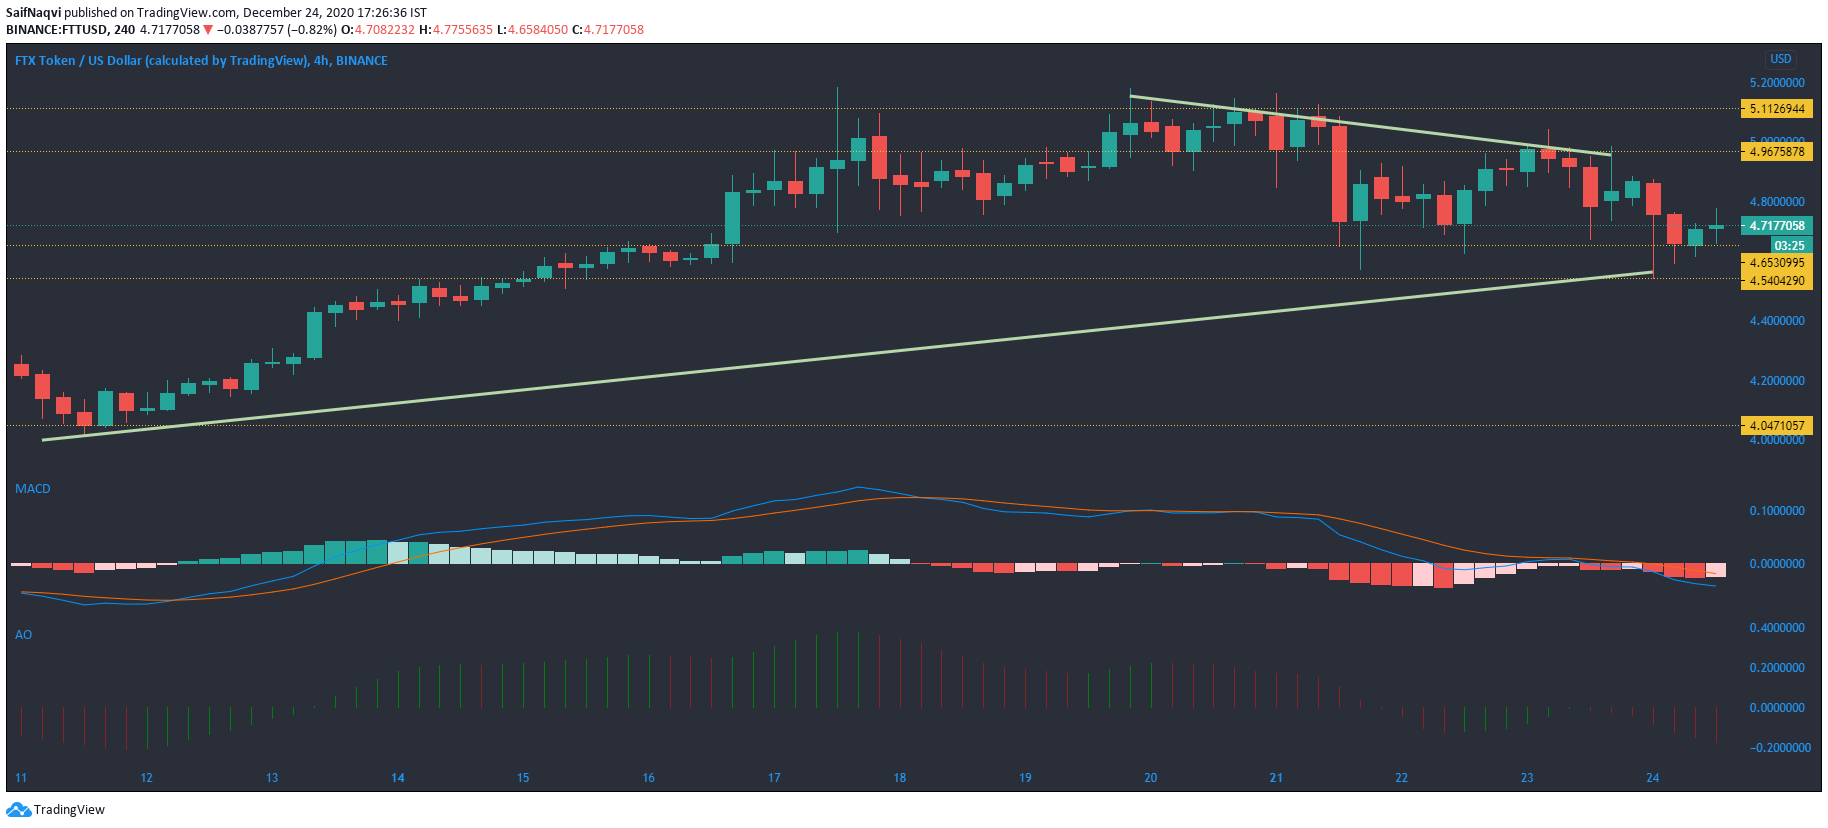
After a difficult start to the month, one that saw prices converge by over 17% by mid-December, FTT managed to regain most of its lost momentum. After hitting the support level at $4.04, the price bounced back and rose above several resistance levels. However, over the past few days, the price had fallen once again and at press time, it was trading between $4.65 and $4.96.
In the near future, the price could fall beyond the current support and test the next support level at $4.54.
The MACD showed that the market once again belonged to the bears as the market’s bulls were trying to take control of the market. The Signal line also moved well above the fast-moving line.
Finally, the Awesome Oscillator also highlighted a rise in bearish momentum.


