Altcoin
Tron’s monthly performance: 6% more transactions, 13% price increase
Tron’s daily average transactions increased by 6% this month compared to the previous month.

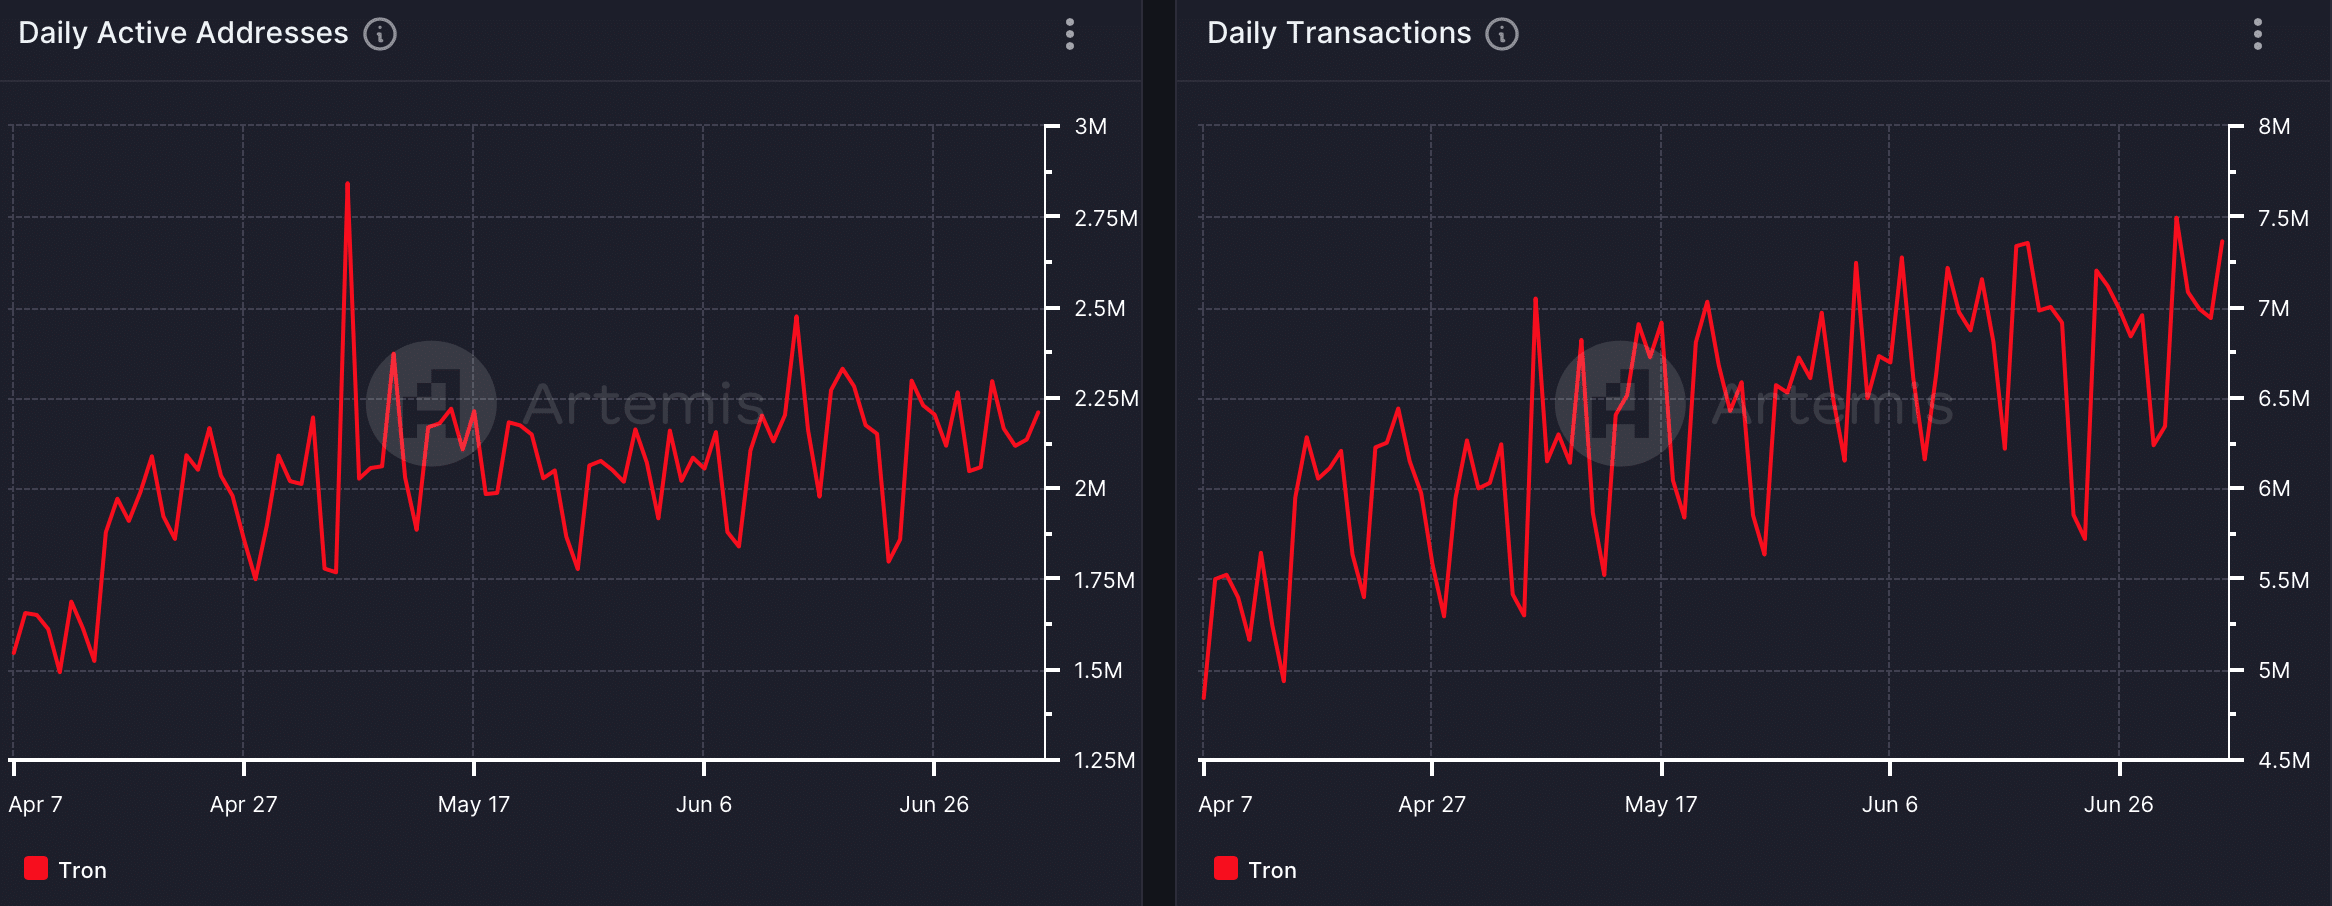
- Tron’s daily active addresses rose consistently.
- TRX’s price increased by over 13% in the last 30 days.
Tron [TRX] has been known for its robust network activity over the last few years. The good news was that the blockchain once again managed to maintain its growing streak last month. ‘
The blockchain’s native token’s price also followed a similar growing trend.
A look at Tron’s network activity
TRONSCAN, a popular X handle that posts updates related to the blockchain’s ecosystem, posted a tweet highlighting the blockchain’s recent achievements.
The tweet mentioned that the average daily transactions on TRON over the last 30 days have been 6.84 million. This represents a 6% increase compared to the previous 30-day period, clearly reflecting a rise in the blockchain’s usage.
To check TRX’s long-term growth, AMBCrypto took a look at Atremis’ data. We found that the blockchain’s daily active addresses have been growing steadily over the past three months.
Thanks to that, the blockchain’s daily transactions also followed a similar trend. This signified a consistent growth in TRX’s adoption.
The better news was that the blockchain’s performance in terms of captured value was good.
We found that over the last three months, both TRX’s fees and revenue remained consistent and stable. However, Tron’s performance in the DeFi market was not on par.
This seemed to be the case, as TRX’s TVL declined sharply over the last three months.
TRX investors are rejoicing
While the blockchain’s network activity was robust, TRX’s performance on the price front also looked optimistic.
CoinMarketCap’s data revealed that the token’s price increased by more than 13% in the last 30 days. Things in the last seven days also looked pretty good, as the token’s value had risen by over 3.5%.
At the time of writing, TRX was trading at $0.1297 with a market capitalization of over $11.3 billion. Over the last month, investors’ confidence in TRX has also remained high.
This was evident from its high-weighted sentiment graph.
AMBCrypto then checked Coinglass’ data to find out what to expect from the token.
As per our analysis, TRX’s long/short ratio had declined. A drop in the metric means that there were more short positions in the market than long positions, which can be considered a bearish signal.
Realistic or not, here’s TRX market cap in BTC‘s terms
Additionally, the Relative Strength Index (RSI) registered a downtick, indicating a possible price decline in the coming days.
Nonetheless, the technical indicator MACD displayed a clear bullish advantage in the market. The Chaikin Money Flow (CMF) moved southward, hinting at a continued price rise.


