


Tron was trading at $0.0135 at press time, recording a gain of 2.91% on the 24-hour price chart. The token had a support at $0.0129, while it needs to break through the resistance placed at $0.0138. The total market cap of the token stood at $904 million.
1-Hour Price Chart

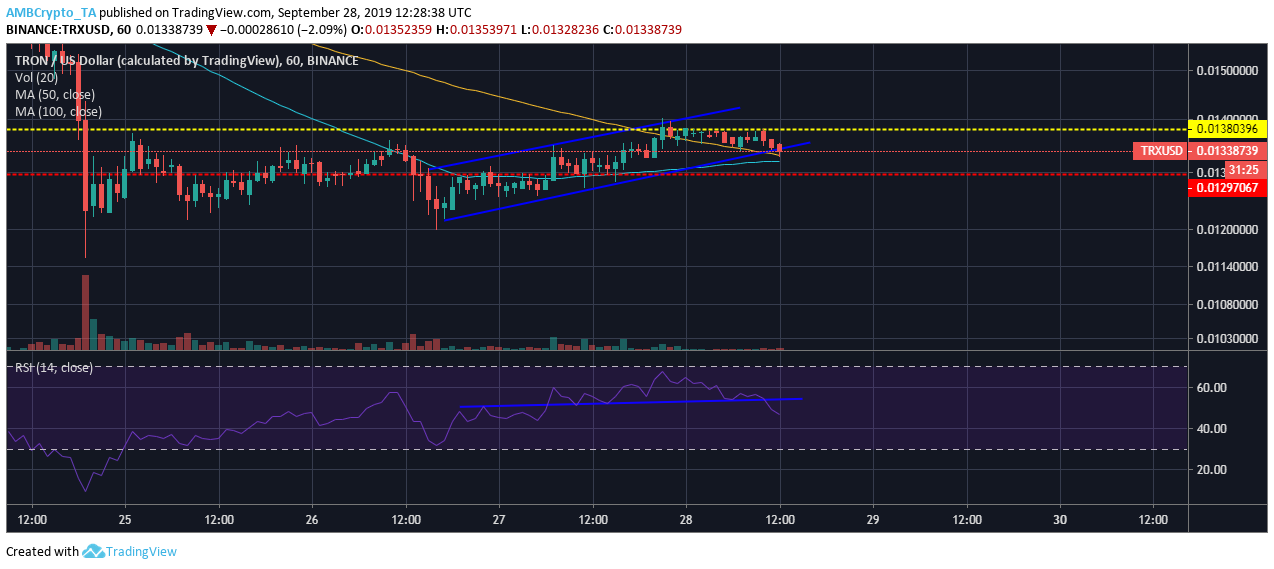
On the one hour price chart, the altcoin is forming an ascending channel which is characterized by a parallel channel with higher highs at $0.0130, $0.0134 and $0.0139, while higher lows are at $0.0121, $0.0126 and $0.0134. The formation of the ascending channel is followed by a downward breakout in price, suggesting some bearish momentum in the market.
The 50-moving average is below the 100-moving average, with the market sentiment on the bearish side. However, a possible bullish crossover might take place if the altcoin is able to break past its key resistance.
The RSI indicator has just broken a critical resistance, with the indicator falling below the median line and suggesting strong bearish sentiment.
Conclusion
Tron looks bearish in the short-term with an ascending channel formation, while the moving average also suggests a bearish sentiment. The RSI indicator breaching a key resistance also highlights bearish sentiment in the market.