TRUMP loses 24% after weekend pump – More losses ahead for memecoin?
The recent rally to $17.75 was expected to reverse. Now that it has, what will be next for TRUMP?

- TRUMP was unable to maintain its bullish H4 structure and shifted bearishly once more
- Liquidation levels at $14, $16, and $18 could reverse the current price bounce
In a recent analysis, AMBCrypto observed that Official Trump’s [TRUMP]rally to $17.75 on Sunday mirrored its mid-February rally. As such, the move was anticipated to be a liquidity grab, and the odds of a reversal were high.
This has come to pass. Since the weekend pump, the memecoin has fallen by 24.23%, making a lower low on the 4-hour timeframe as well. The selling volume has been sizeable, with Bitcoin [BTC] continuing to trade below the key resistance zone at $90k-$92k.
These factors will make it harder for TRUMP bulls to enforce a recovery.
Official Trump to face resistance at $14, bearish reversal likely
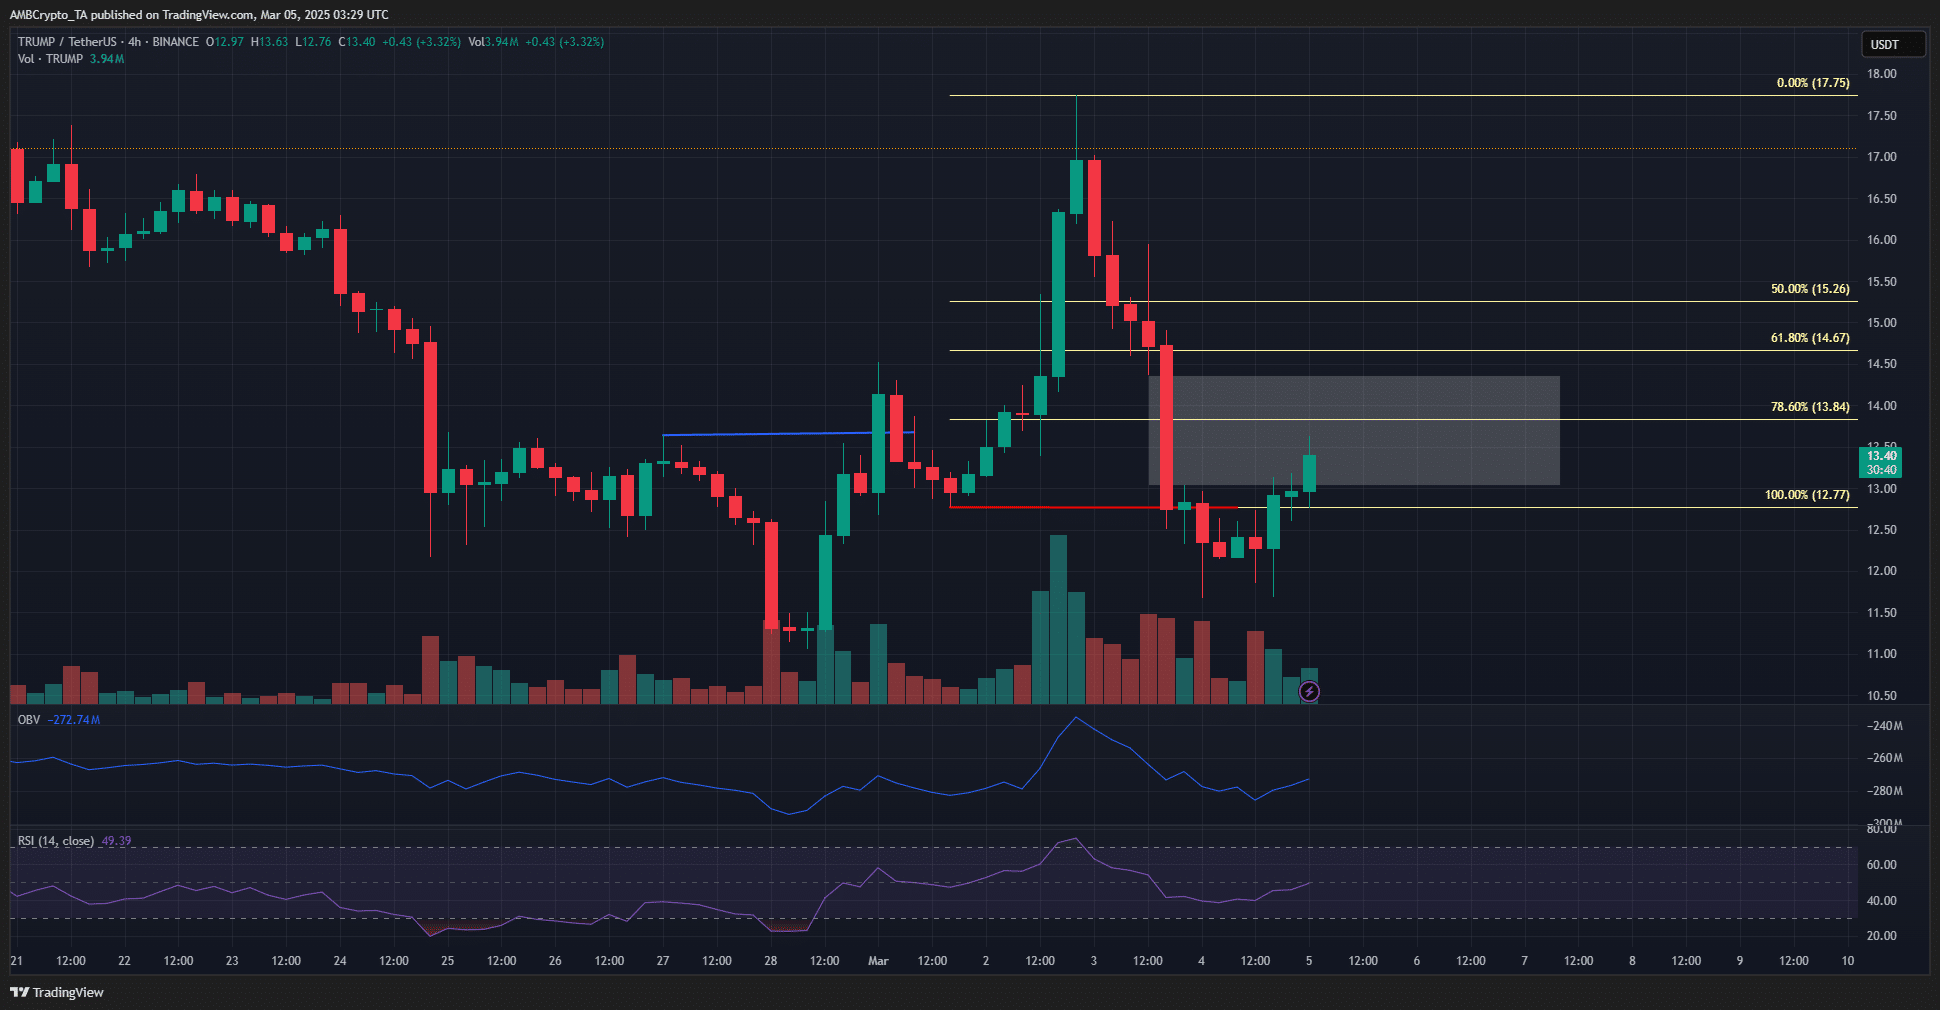
On 01 March, TRUMP saw a bullish market structure break (blue), with the subsequent rally reaching $17.75 before reversing. This was followed by a swift bearish market structure shift (red) when the price fell below $12.27.
The suddenness of the price drop on Monday meant there was a large fair value gap (white) left overhead. This zone is likely to act as resistance and lined up well with the $14-$14.25 resistance zone.
Therefore, it is likely that Official Trump would halt its current move around $14. Further north, the next resistance zone would be at $16.5-$17. While traders can anticipate a move south from $14, they should also be prepared to cut their losses in case TRUMP moves beyond $15.
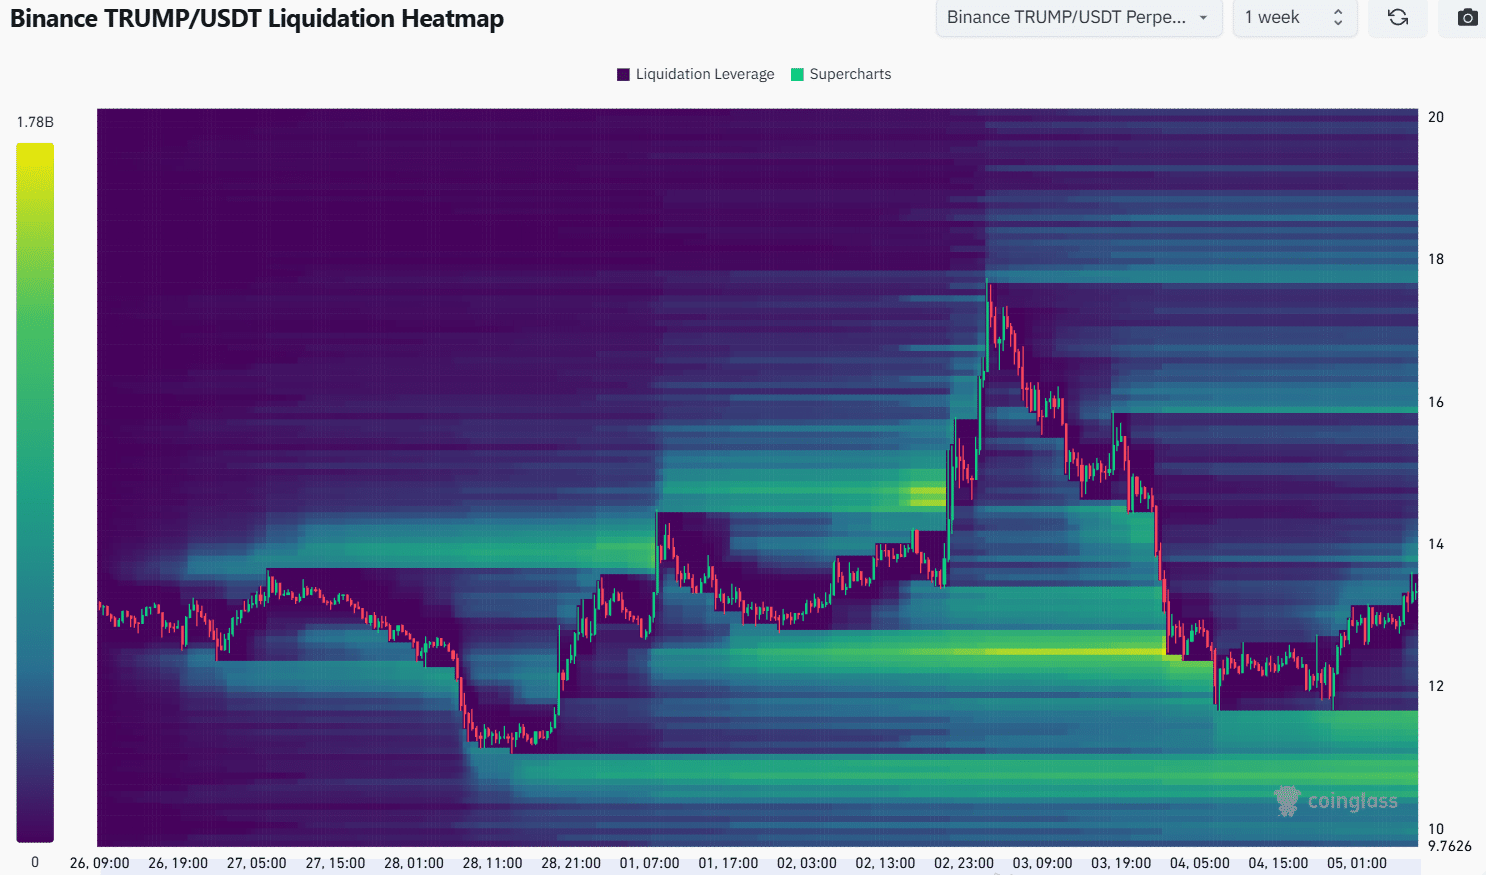
The 1-week liquidation heatmap highlighted the $13.8-$14 and $15.9-$16.1 levels as the magnetic zones of interest upwards of the price. The $11.25-$11.6 region to the downside is also an attractive liquidity target.
As mentioned earlier, a move beyond $15 would invalidate the idea of an immediate price drop towards $12. The shorter-period liquidation heatmaps highlighted $18, the recent local highs, as another key liquidity cluster.
Attempting to swing trade under these conditions could be dangerous, and scalping might be more favorable. Traders can also opt to remain sidelined until the $18-level, a stronger resistance zone, is retested.
Disclaimer: The information presented does not constitute financial, investment, trading, or other types of advice and is solely the writer’s opinion


