TRX investors are hopeful, and that’s not a good idea

- As per Tron’s weekly report, the number of TRX accounts exceeded 164 million.
- However, the daily chart didn’t favor the buyers and flashed bearish signs for the altcoin
Tron [TRX] has had quite an eventful month as its price managed to stay in the green for most of last month. Additionally, TRX going live on the Ethereum [ETH] blockchain also added to TRX’s liquidity on a massive scale.
However, Tron’s weekly report also had another development to offer. The report released on 6 June stated that the number of TRX accounts exceeded 164 million as of 6 June.
Furthermore, a tweet posted by TronScan also pointed out that the total transfer of stablecoins reached $14,017,570,889 which could be taken as a positive sign for the blockchain.
?The total transfer volume of #stablecoins on #TRON network reached $14,017,570,889 ! #USDD #USDT #USDJ #TUSD #USDC pic.twitter.com/VXiAe8mjTI
— TRONSCAN (@TRONSCAN_ORG) June 6, 2023
How much are 1,10,100 TRXs worth today?
Are TRX bulls running away?
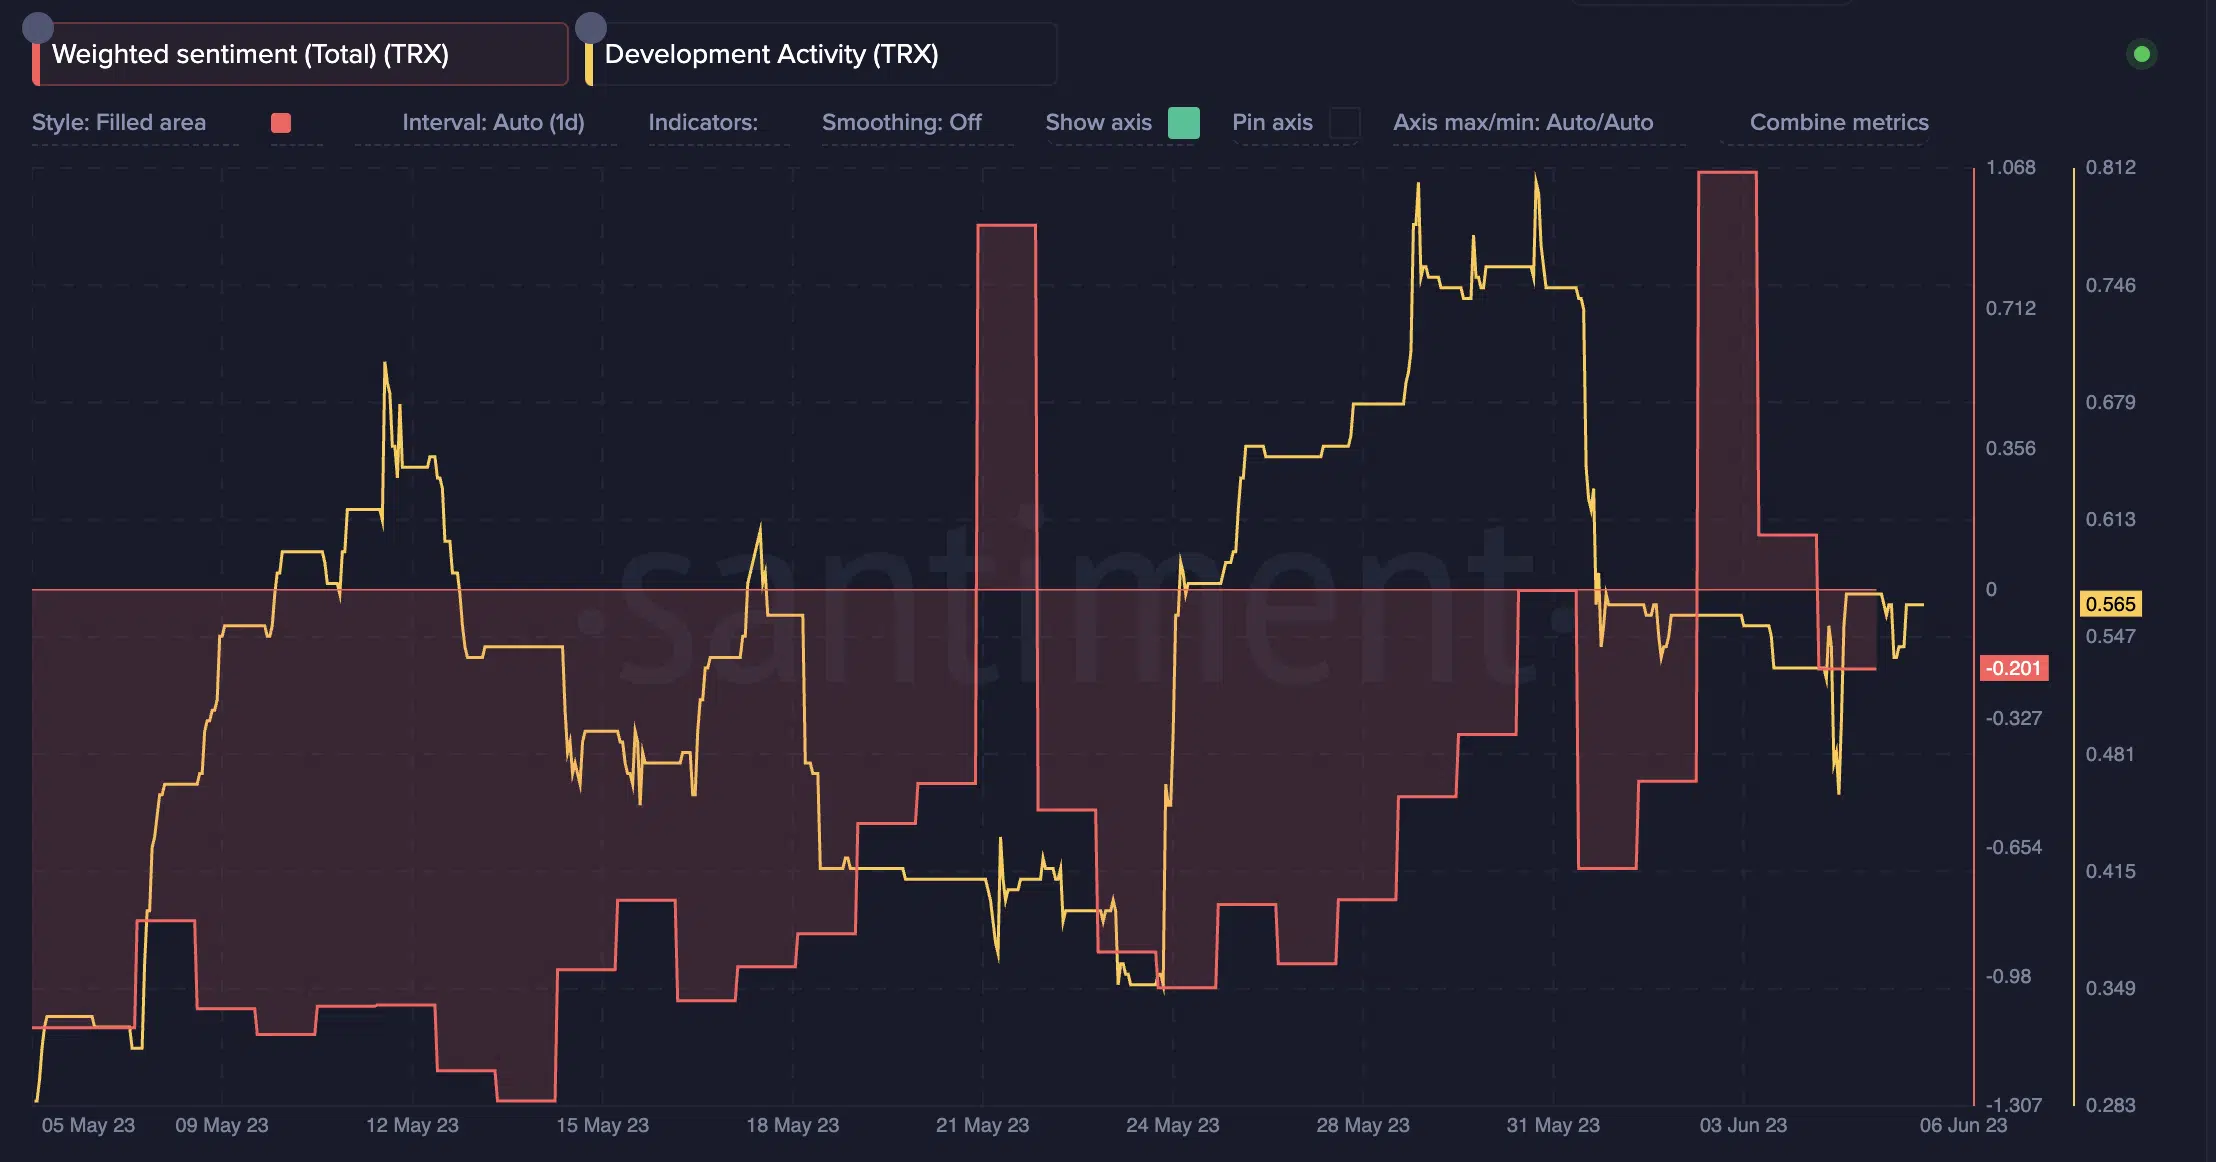
At the time of writing, data from the intelligence platform Santiment showed that TRX’s development activity witnessed a notable downfall over the last few days. Tron’s development activity went from a high of 0.80 on 31 May to stand at 0.56 at press time. This wasn’t a great sign for the network.
Furthermore, a look at the weighted sentiment also showed a significant drop over the last few days. TRX’s weighted sentiment dropped from 1.06 on 3 June to -0.201 as of 6 June. This indicated that the crypto community didn’t exactly have a positive outlook toward the network.
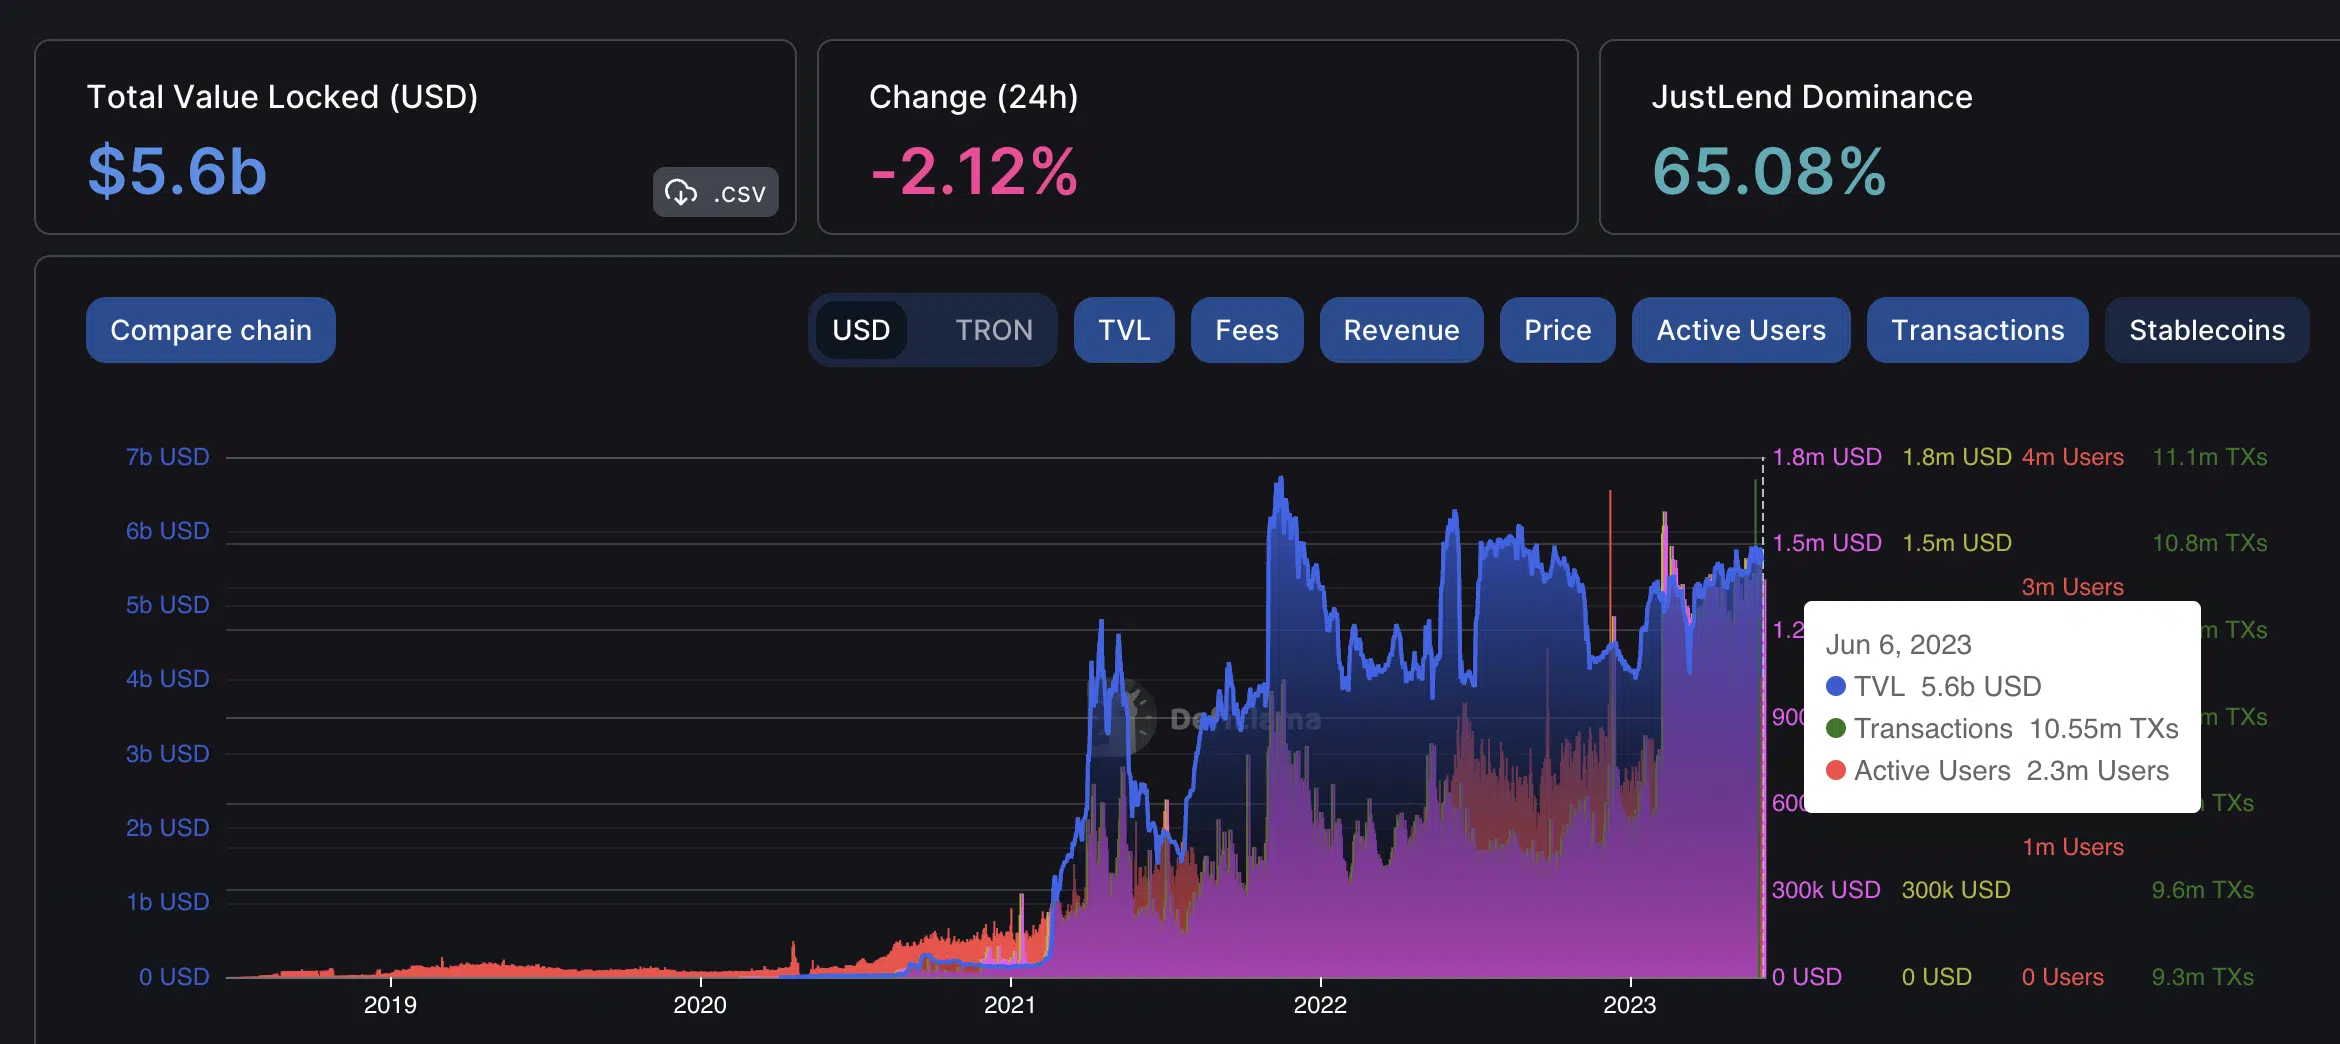
In addition to the aforementioned information, TRX’s Total Value Locked (TVL) witnessed a 2.12% drop in the last 24 hours and stood at 5.6 billion at the time of writing.
A drop in the TVL meant that investors were losing interest in staking their tokens on the network. Although the drop wasn’t significant enough it did put forth a slightly bearish investor sentiment.
A not-so-happy TRX
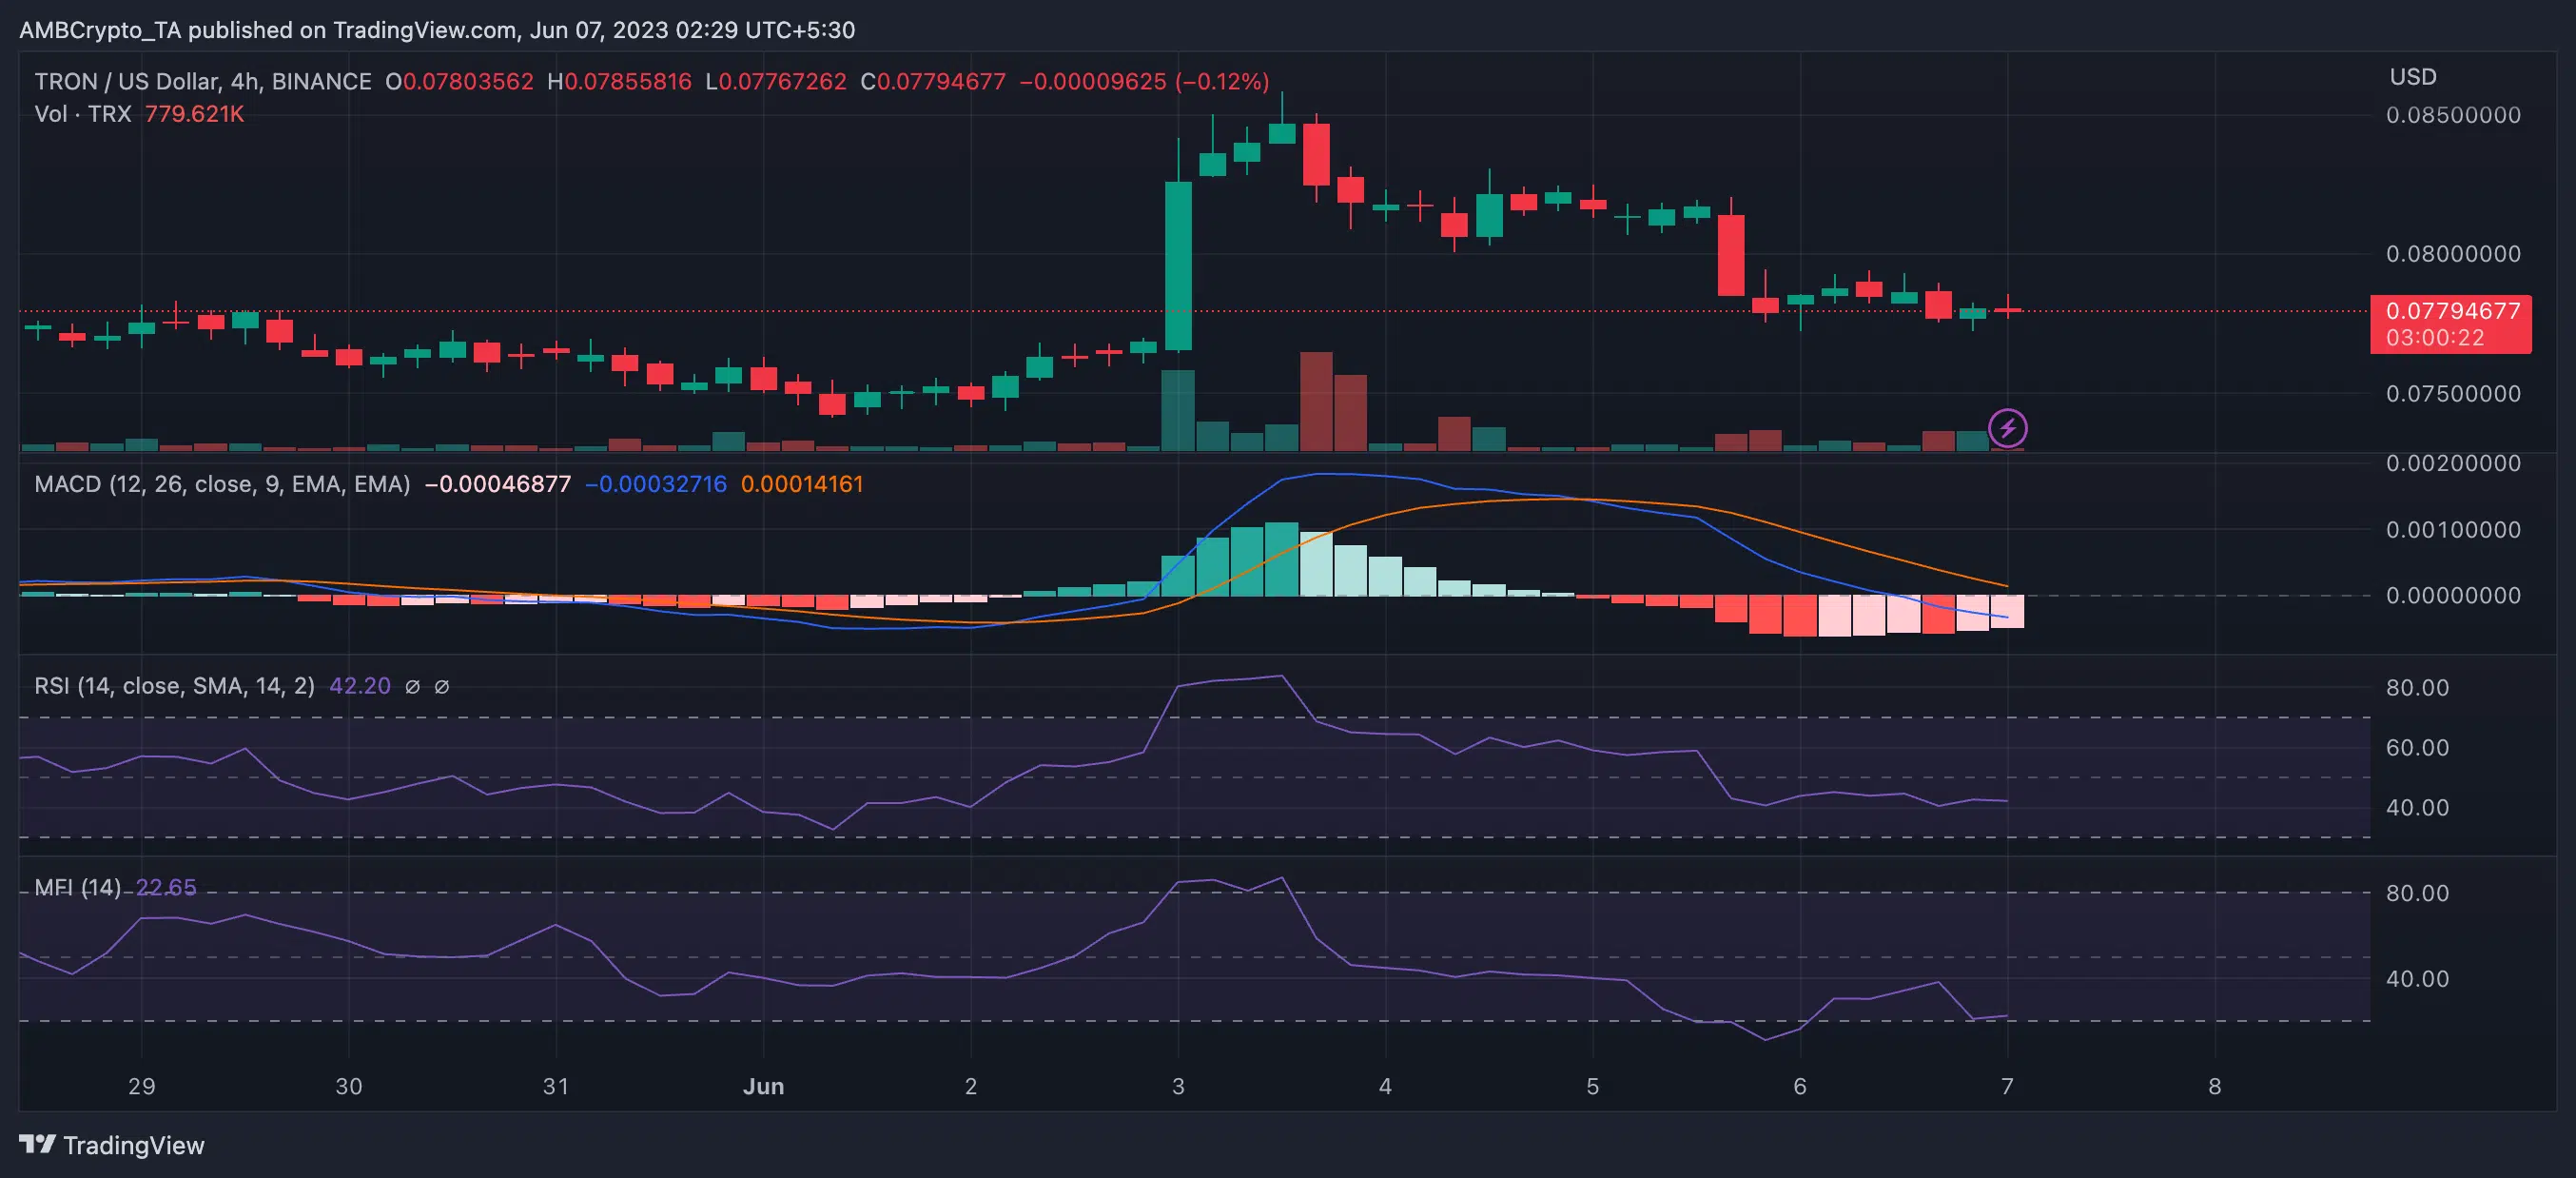
At the time of writing, TRX was exchanging hands in the red at $0.07794. Furthermore, a look at TRX’s Moving Average Convergence Divergence (MACD) confirmed the ongoing bearish trajectory. The MACD line (blue) was moving below the signal line (red) below the zero line. This was a bearish movement.
Realistic or not, here’s TRX’s market cap in BTC terms
Furthermore, TRX’s Relative Strength Index (RSI) and Money Flow Index (MFI) too flashed bearish signs. While the RSI stood below the neutral line at 42.20, the MFI stood at 22.65. Both these indicators indicated that selling pressure outweighed buying pressure and the flow of liquidity in the market was witnessing a drop.
But, data from CoinMarketCap revealed that TRX was up by a meager 0.49% in the last 24 hours and by 1.88% in the last seven days. Furthermore, TRX surged by a massive 10% over the last month. This meant that there was some hope for recovery, however, traders would have to move forward with caution.


