


Disclaimer: The information presented does not constitute financial, investment, trading, or other types of advice and is solely the writer’s opinion.
- Uniswap indicators showed a lack of buying pressure behind the token, especially after its recent pullback
- Even though multiple factors suggested otherwise, it was possible that the bulls could force a rally toward $4.5 or beyond
Uniswap [UNI] fell below the lows of a month-long range in mid-October. However, the subsequent downtrend took UNI only as low as $3.83 before the bulls entered the market in numbers.
Read Uniswap’s [UNI] Price Prediction 2023-24
The recovery saw a healthy retracement and the market showed promising signs, but the on-chain activity of the Uniswap Foundation could worry the bulls. The decline in Total Value Locked (TVL) was also a concern.
The Fibonacci retracement levels promised another rally for UNI
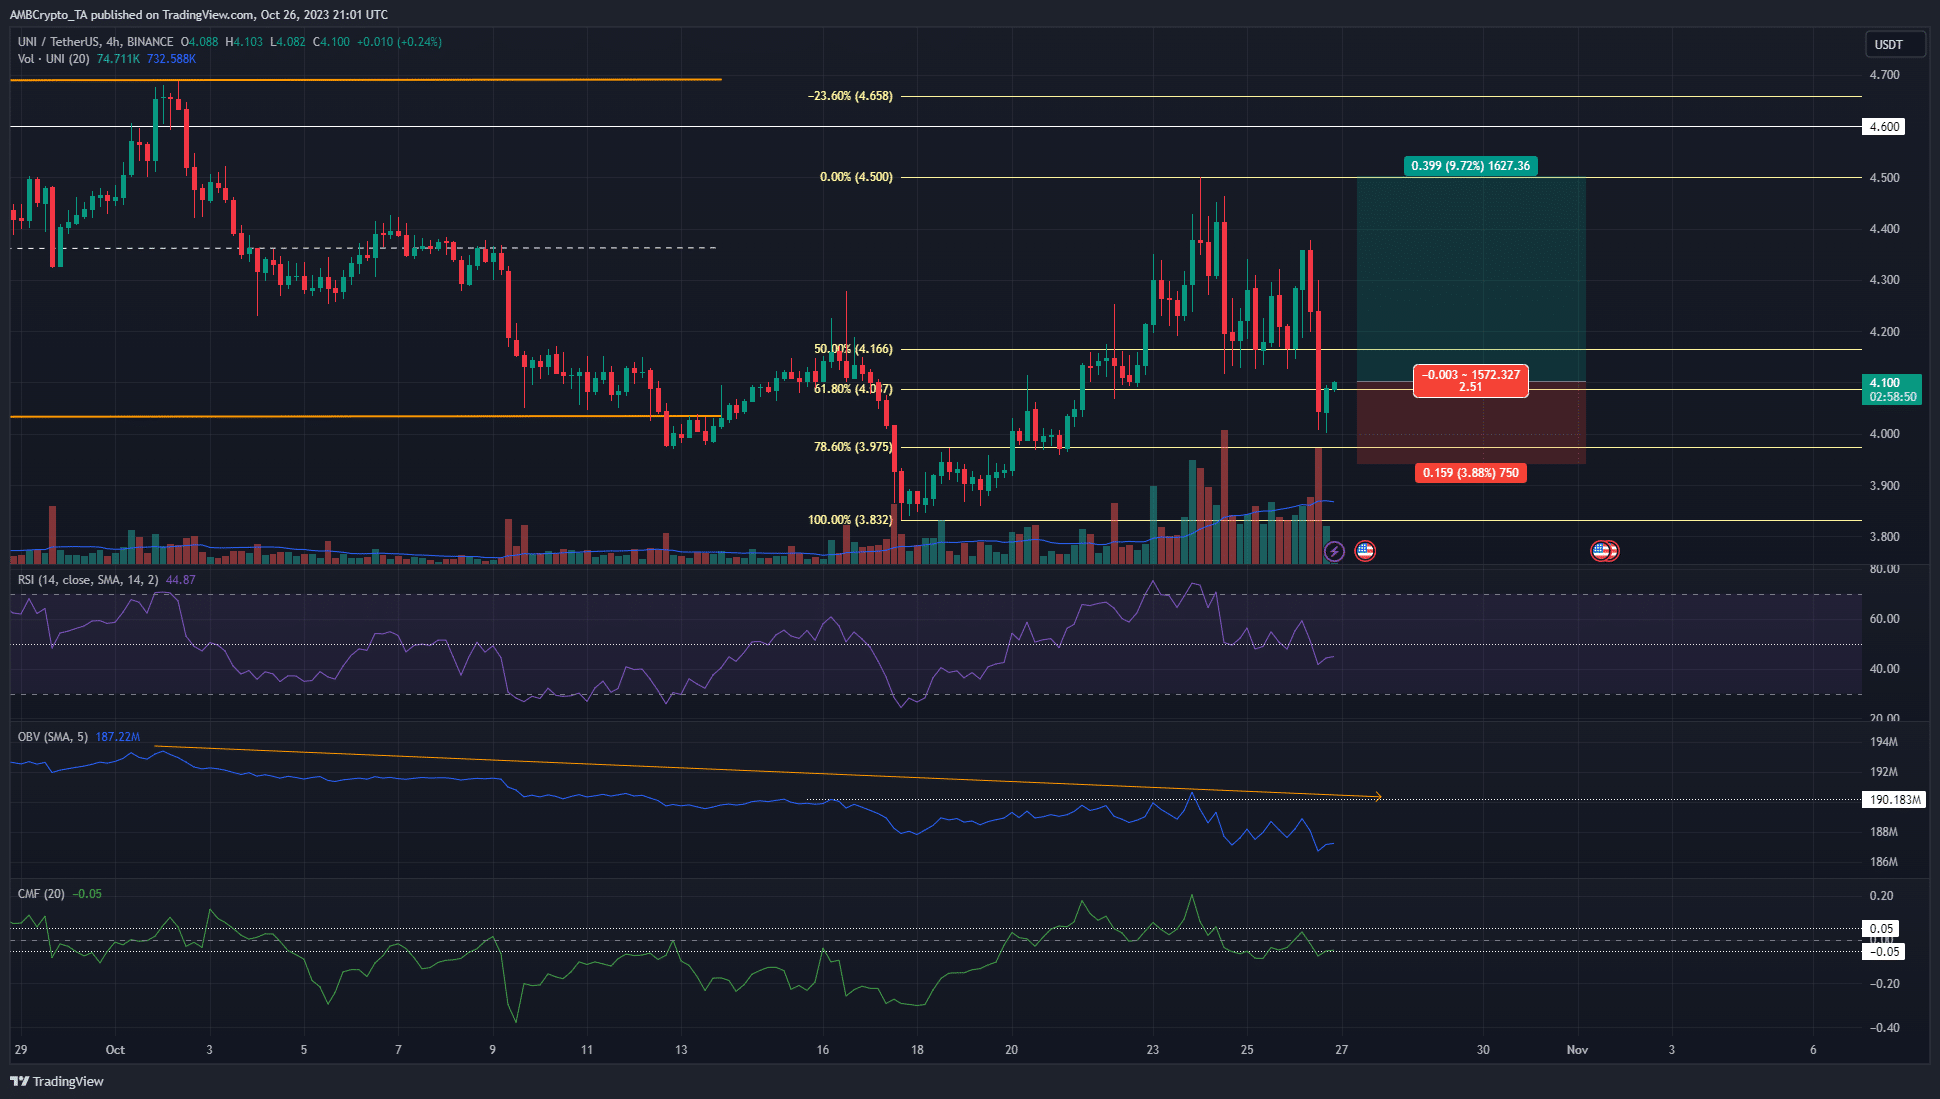
The price action of UNI on the four-hour chart revealed a bearish market structure. Additionally, the Relative Strength Index (RSI) also slipped below neutral 50 to indicate bearish momentum. Yet, the recent drop represented a viable buying opportunity.
Fibonacci retracement levels (pale yellow) noted that the $3.97 level was the 78.6% retracement level for the recent move to $4.5. Therefore, traders could be justified in going long. However, they must temper their expectations of profit with caution.
The On-Balance Volume (OBV) has been in a downtrend since August. The Chaikin Money Flow (CMF) spent the majority of October under the +0.05 level, only occasionally climbing higher. The inference was that capital inflow was not significant despite the price gains, which suggested a lack of demand for UNI.
The sentiment was firmly bullish from futures traders
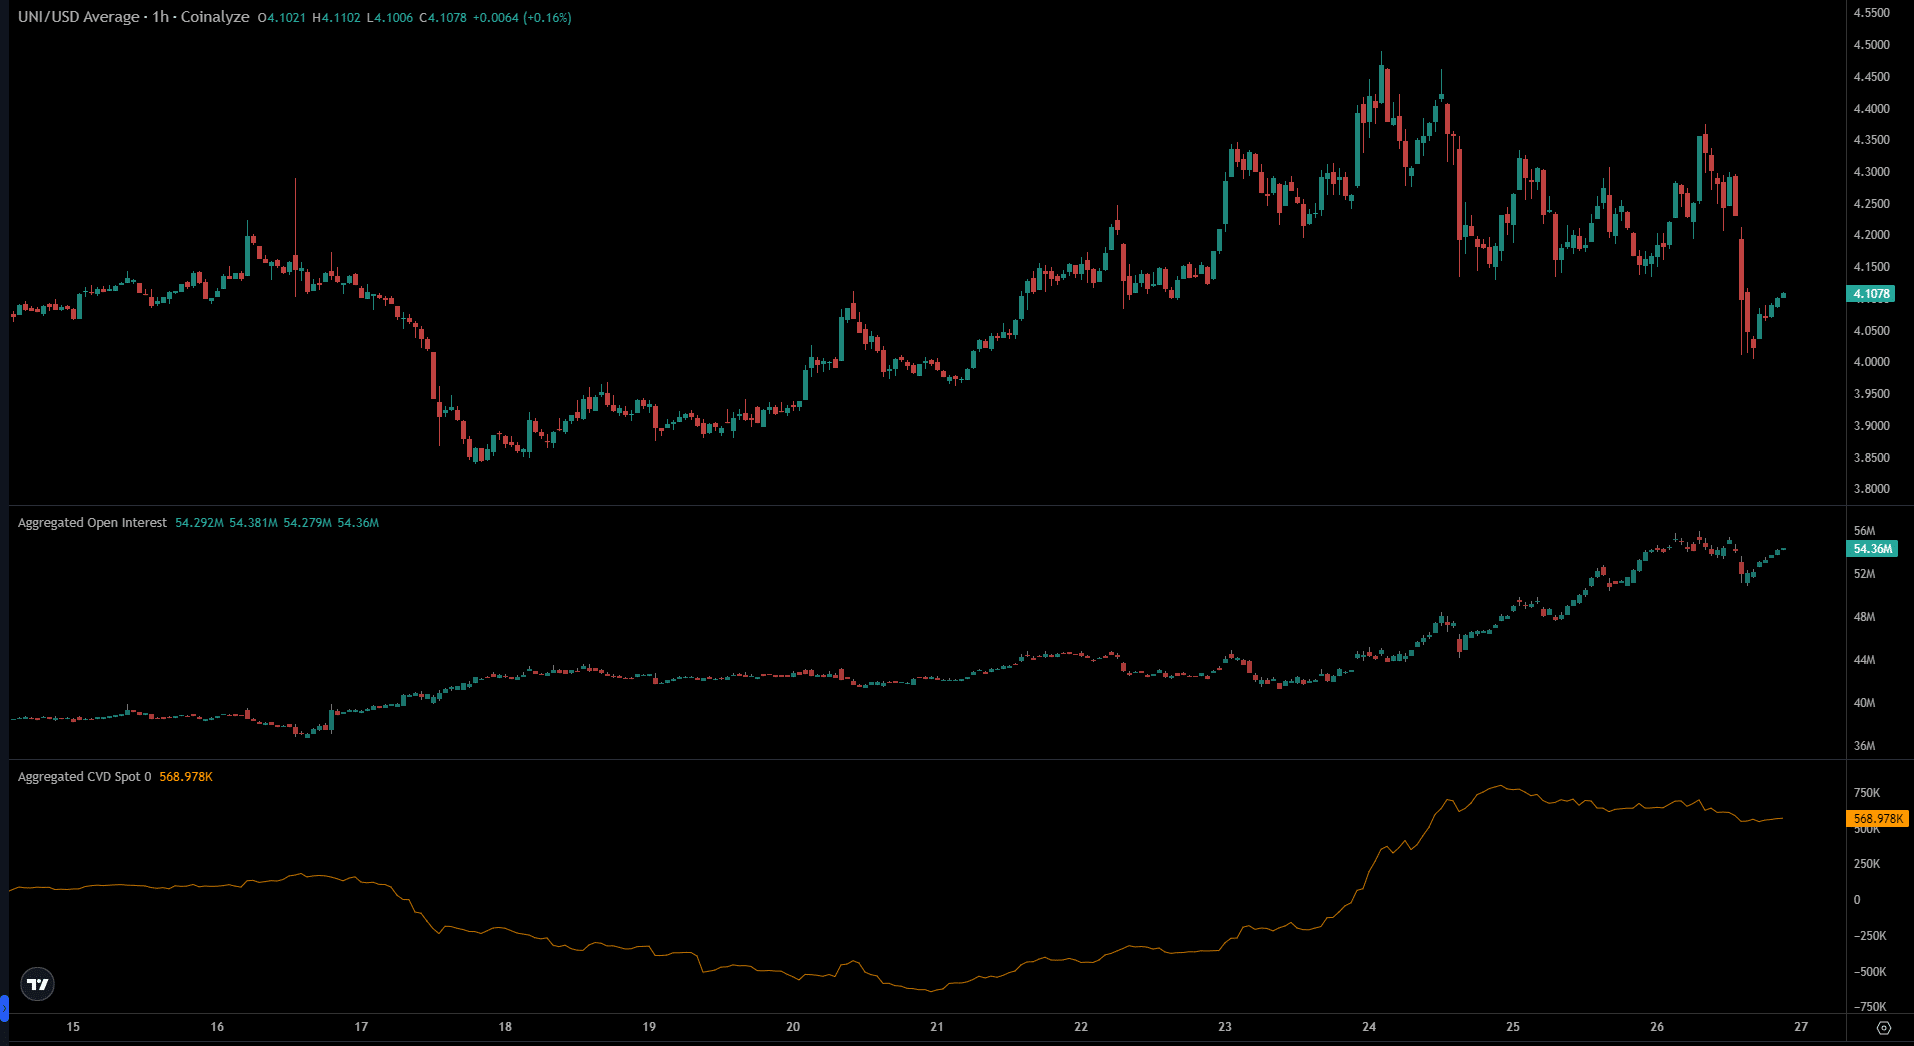
The Open Interest (OI) chart trended higher over the past three days, even though UNI saw a deep pullback. Each price bounce was accompanied by a rise in the OI, although there were instances when short-sellers capitalized on rapidly dropping prices.
Is your portfolio green? Check the Uniswap Profit Calculator
In the past few hours, UNI climbed from $4.01 to $4.1 and the OI rose by close to $2.5 million worth of contracts. This suggested sentiment was bullish in the short term. On the other hand, the spot Cumulative Spot Delta (CVD) noted a slow but steady decline since 25 October.
Once more, it was a clue that buying pressure was weak at the time of writing. Despite these shortcomings, a long position targeting $4.5 with invalidation just below $3.97 made sense from a price action perspective.