UNI risks drop to $1.78 despite accumulation: Will fee switch save Uniswap in 2027?
On-chain data showed a divergence with the bearish price trends and indicated a shift in holder composition.

Uniswap [UNI] token’s daily trading volume was down 26%, though the altcoin rallied 2% in the past 24 hours. It was laboring under a longer-term downtrend, and has fallen by almost 20% over the past week.
The losses came alongside a wider market sell-off, as Bitcoin [BTC] retreated from $67k to $62k in a week.
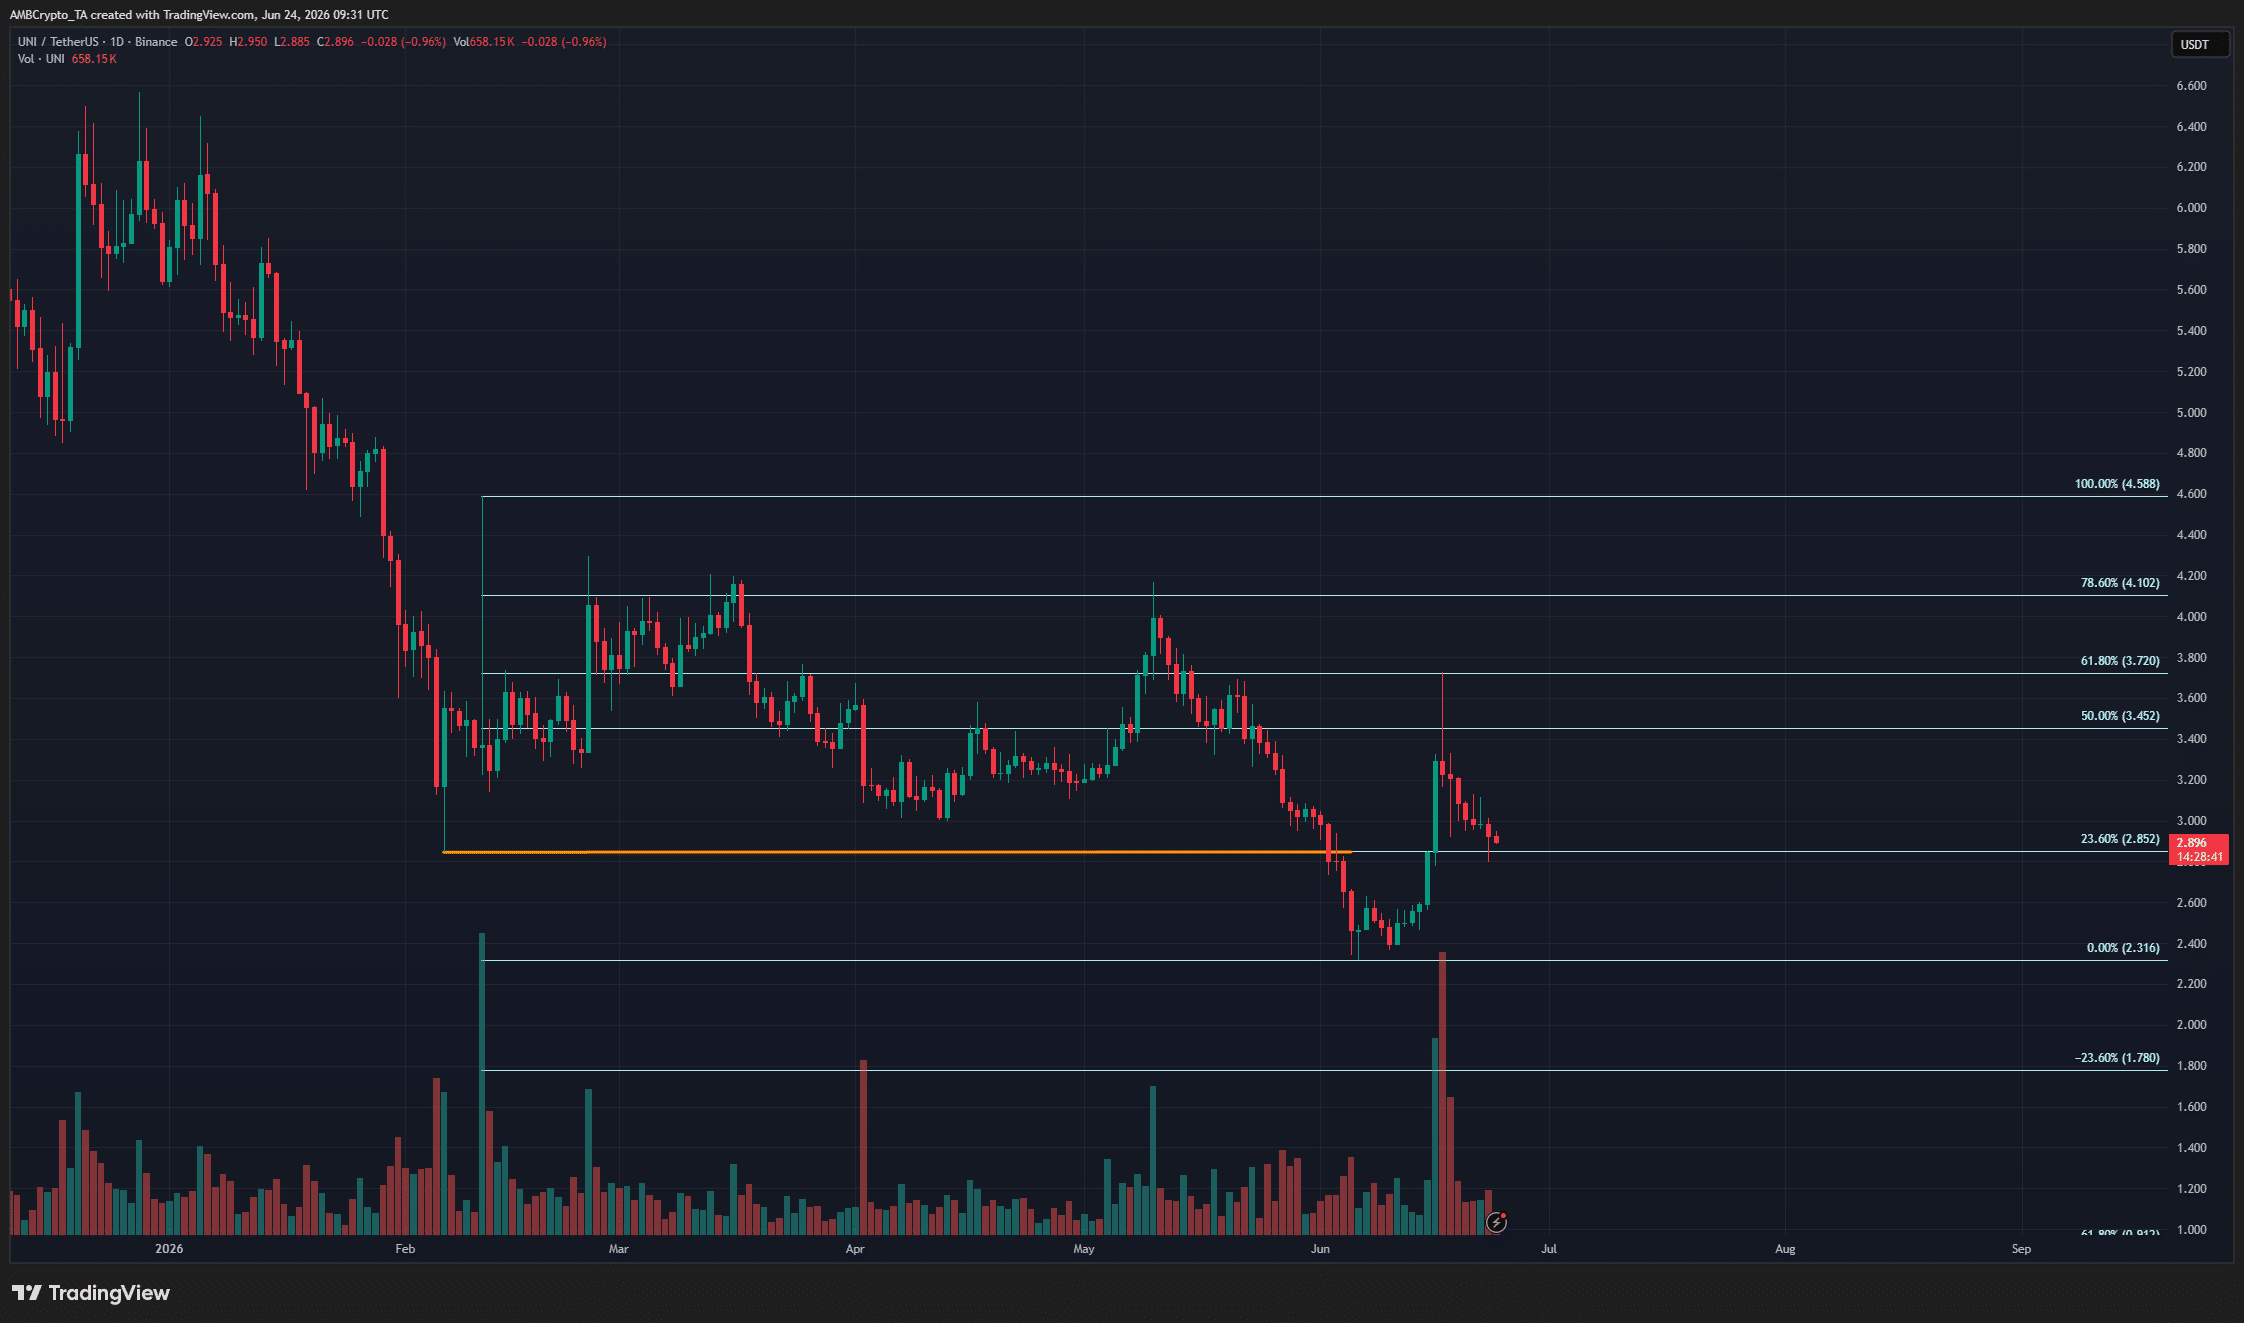
On the 1-day chart, the swing structure was bearish. The latest downward continuation came about earlier in June, when the prices dropped past the $2.845 low to reach $2.316. Based on the latest leg downward, a set of Fibonacci retracement levels was plotted.
It showed that the price bounce to $3.72 last week was only a relief rally. This bounce reached the 61.8% retracement level but has since begun to plummet, in line with the higher timeframe price trend.
Can UNI accumulation trends halt the downtrend?
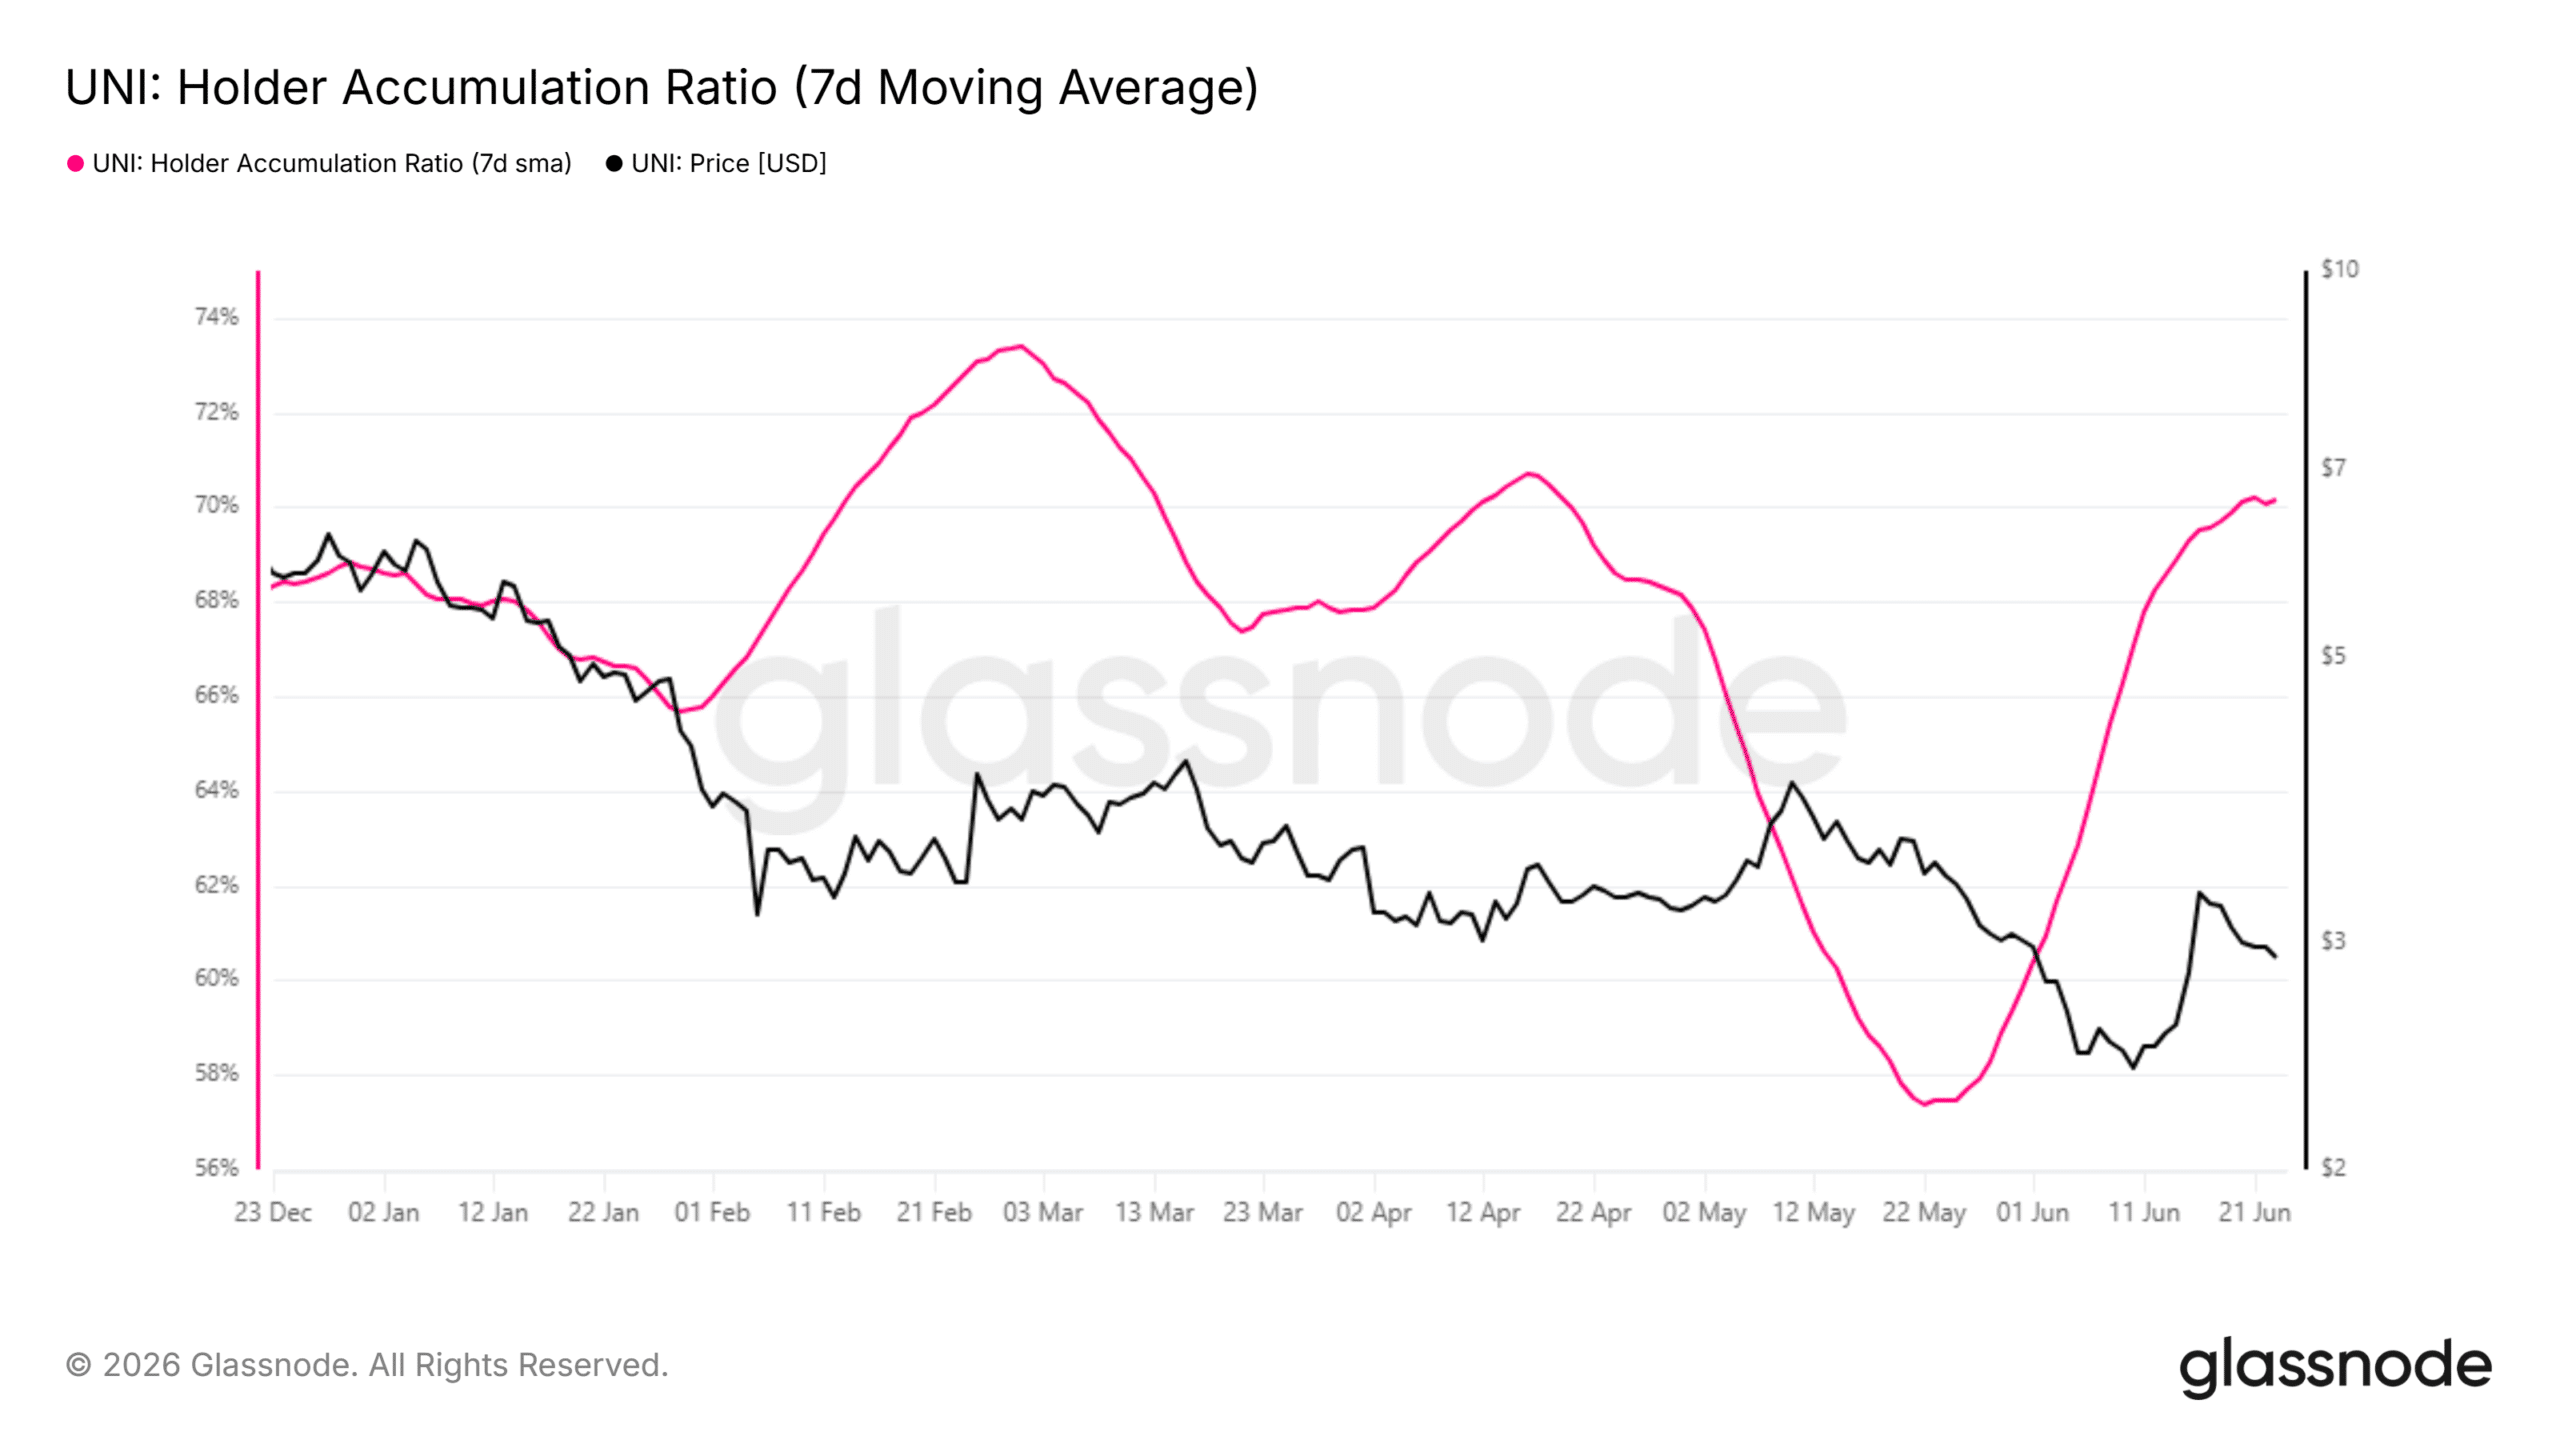
The Uniswap holder accumulation ratio’s weekly moving average has been trending higher over the past month. This metric tracks the proportion of active holders whose positions increased in size, compared to those whose position size reduced.
Since it focuses exclusively on active users, it can give some insight into what active market participants are up to.
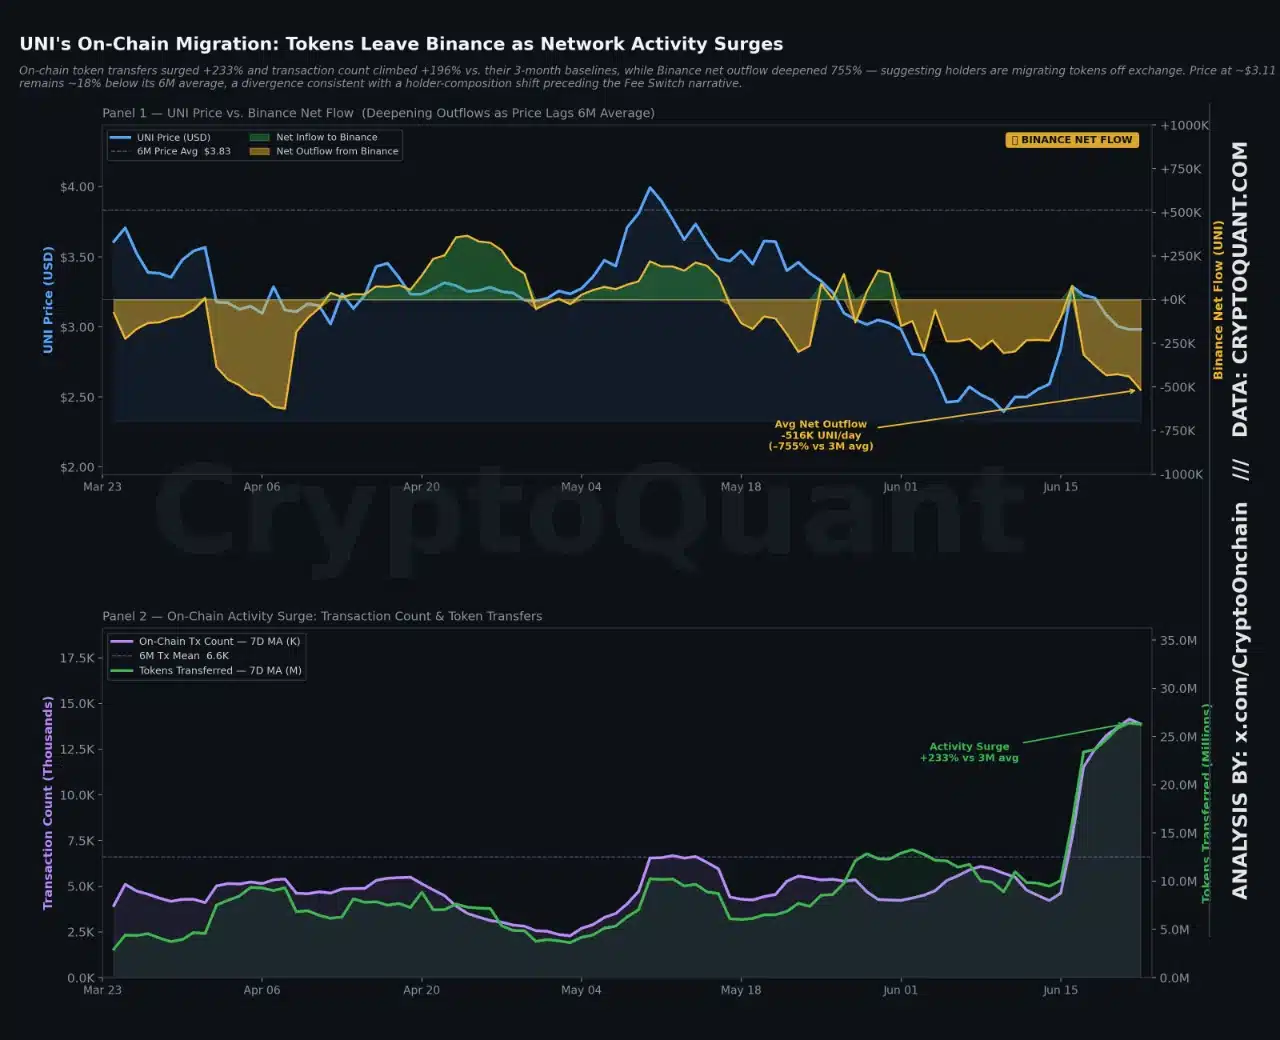
Crypto analyst CryptoOnchain pointed out that the Uniswap onchain data was showing a structural shift, disconnected from the spot price. Over the past three months, total transaction count increased by 196%, and the total tokens transferred on the network surged by 233%.
The UNIfication proposal was approved in late 2025. The fee switch activation, a buy-and-burn model that went live earlier this year, has led to the divergence between onchain metrics and spot price, the analyst wrote.
The 7-day average netflow from Binance was -516,112 UNI, which was 755% more negative than the 3-month baseline flows.
The exchange reserves on Binance have also decreased by 6.8%.
Sustained outflows from exchanges combined with falling reserves point to accumulation. This trend has been ongoing for six months, but the UNI price trends have remained bearish.
A renewed wave of demand can accompany a broader market sentiment shift later this year or early in 2027. This could catalyze a turnaround in UNI’s fortunes. Until then, the data suggests a holder composition shift, and investors shouldn’t expect a transition to an immediate rally.
Final Summary
- Uniswap’s long-term price trends remained bearish, and a downward move to $2.31 and $1.78 is possible in the coming weeks.
- The on-chain data showed a divergence with the bearish price trends and indicated a shift in holder composition.