UNI traders are optimistic, but here’s why there’s the emerging Q of ‘how long’

UNI’s performance last week was commendable as it outperformed many of the market’s usual top gainers with >10% gains of its own. Needless to say, this development brought some respite to hopeful investors.
At press time, UNI was trading at $6.33 with a market capitalization of over $4.8 billion. UNI’s latest movements have a lot to do with developments in the ecosystem, each of which might have pushed its price north.
However, several market indicators and on-chain metrics suggest that a trend reversal might happen soon.
UNI: A tale of bears and bulls
On 29 September, UNI made its place among the top 5000 Ethereum whales’ holdings. This development, while promising, is also a sign of whales’ trust in the altcoin.
https://twitter.com/WhaleStats/status/1575199741113253904?s=20&t=ZeFB_A3sTJ69M42daJpUaw
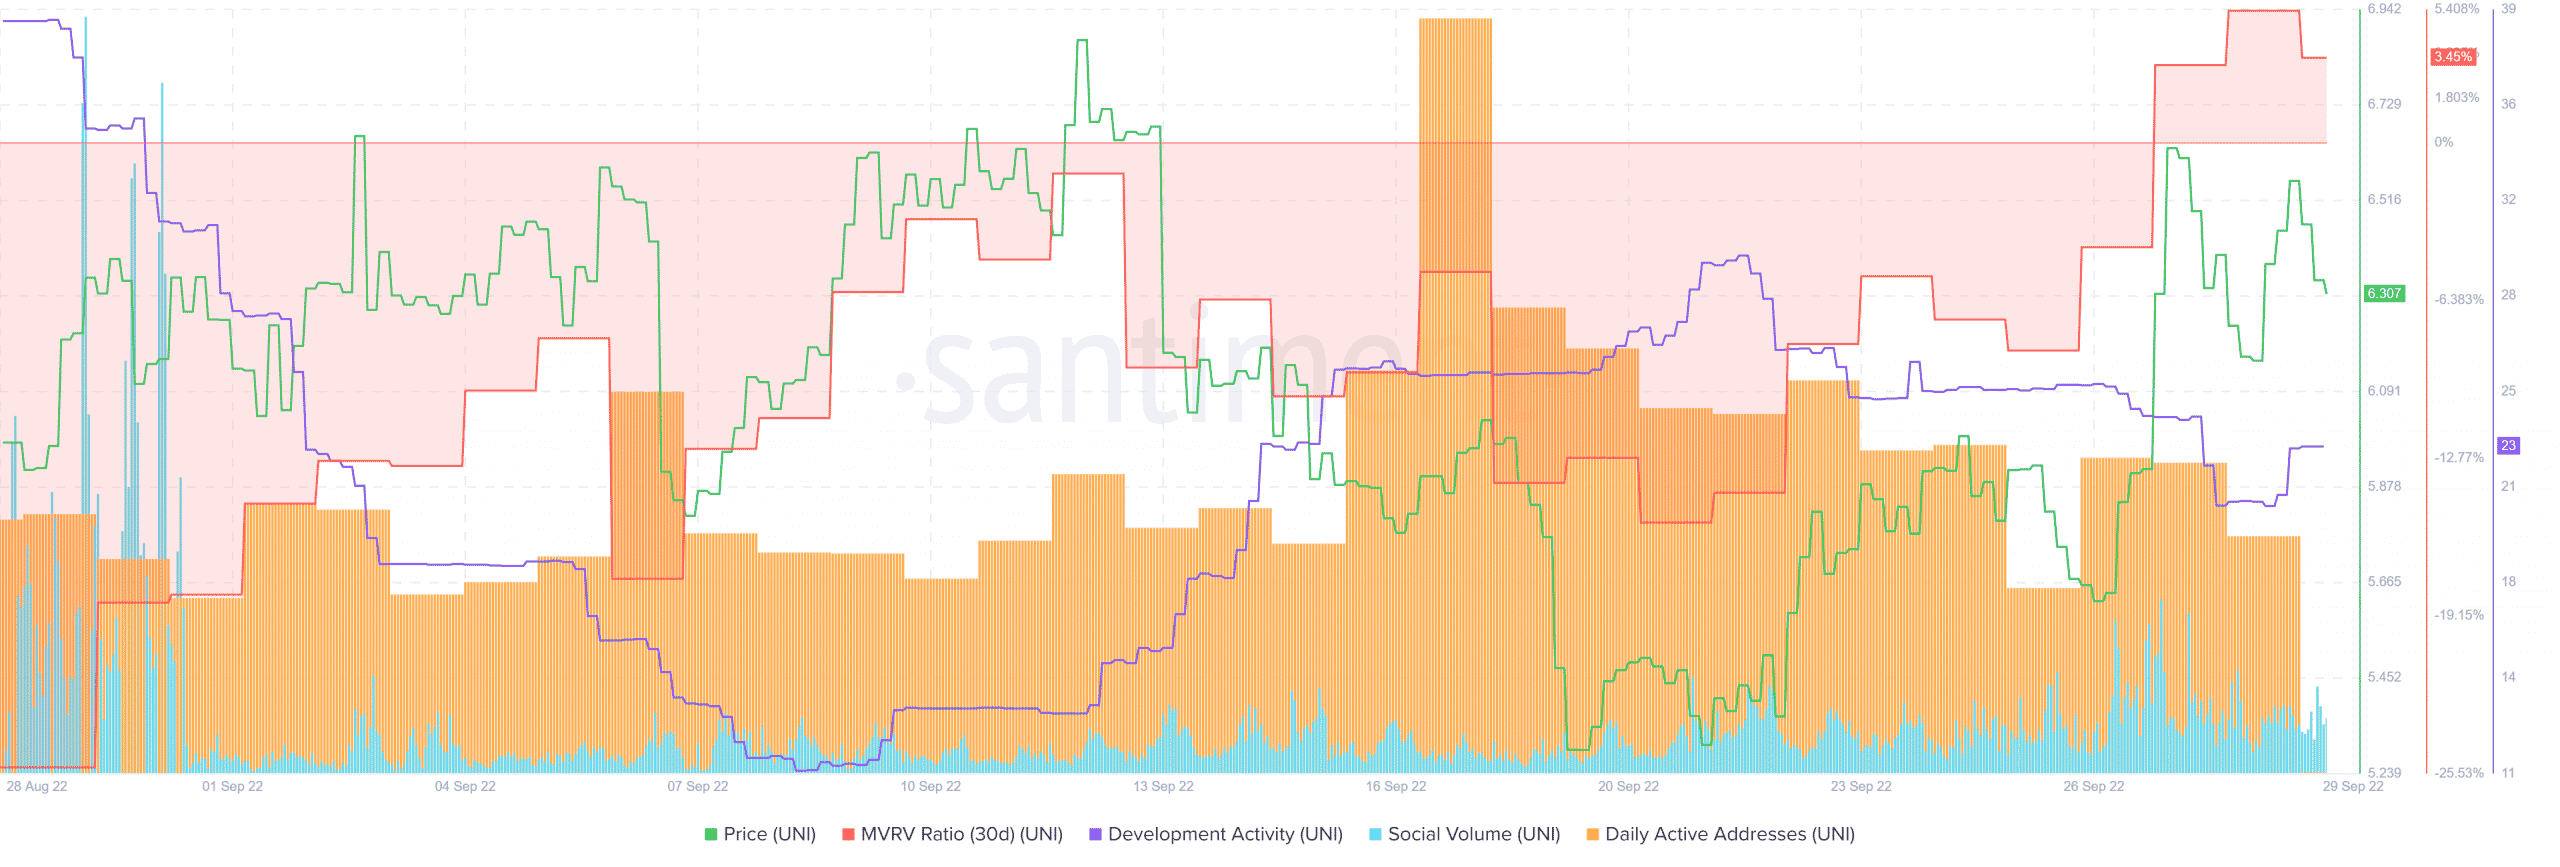
Furthermore, UNI’s Market Value to Realized Value (MVRV) Ratio was up between 28 and 29 September. UNI’s social volume also registered an uptick in the last few days, despite dropping a bit at press time.
However, despite these positive developments, UNI’s development activity seemed to be pretty stagnant – A thumbs down of sorts. Interestingly, after registering a spike, UNI’s daily active addresses also declined.
To add to the basket of developments in favor of UNI, Uniswap Labs recently shared a tweet highlighting their efforts in making the UNI ecosystem better.
According to the tweet, 110+ projects have used UNI’s Widget to integrate the power of Uniswap with one line of code.
1/ We’re all about making web3 easier for developers.
110+ projects have used our Widget to integrate the power of Uniswap with 1 line of code.
One of our faves is @tryrollhq, which makes it easy to build & support creator & social economies. pic.twitter.com/Duzix6Jd9K
— Uniswap Labs 🦄 (@Uniswap) September 27, 2022
However, contrary to the nature of the aforementioned developments, a negative signal was revealed by CryptoQuant’s data.
This data pointed out that UNI’s exchange reserve was rising, which indicated higher selling pressure, increasing the possibility of a price decline soon.
The final vote
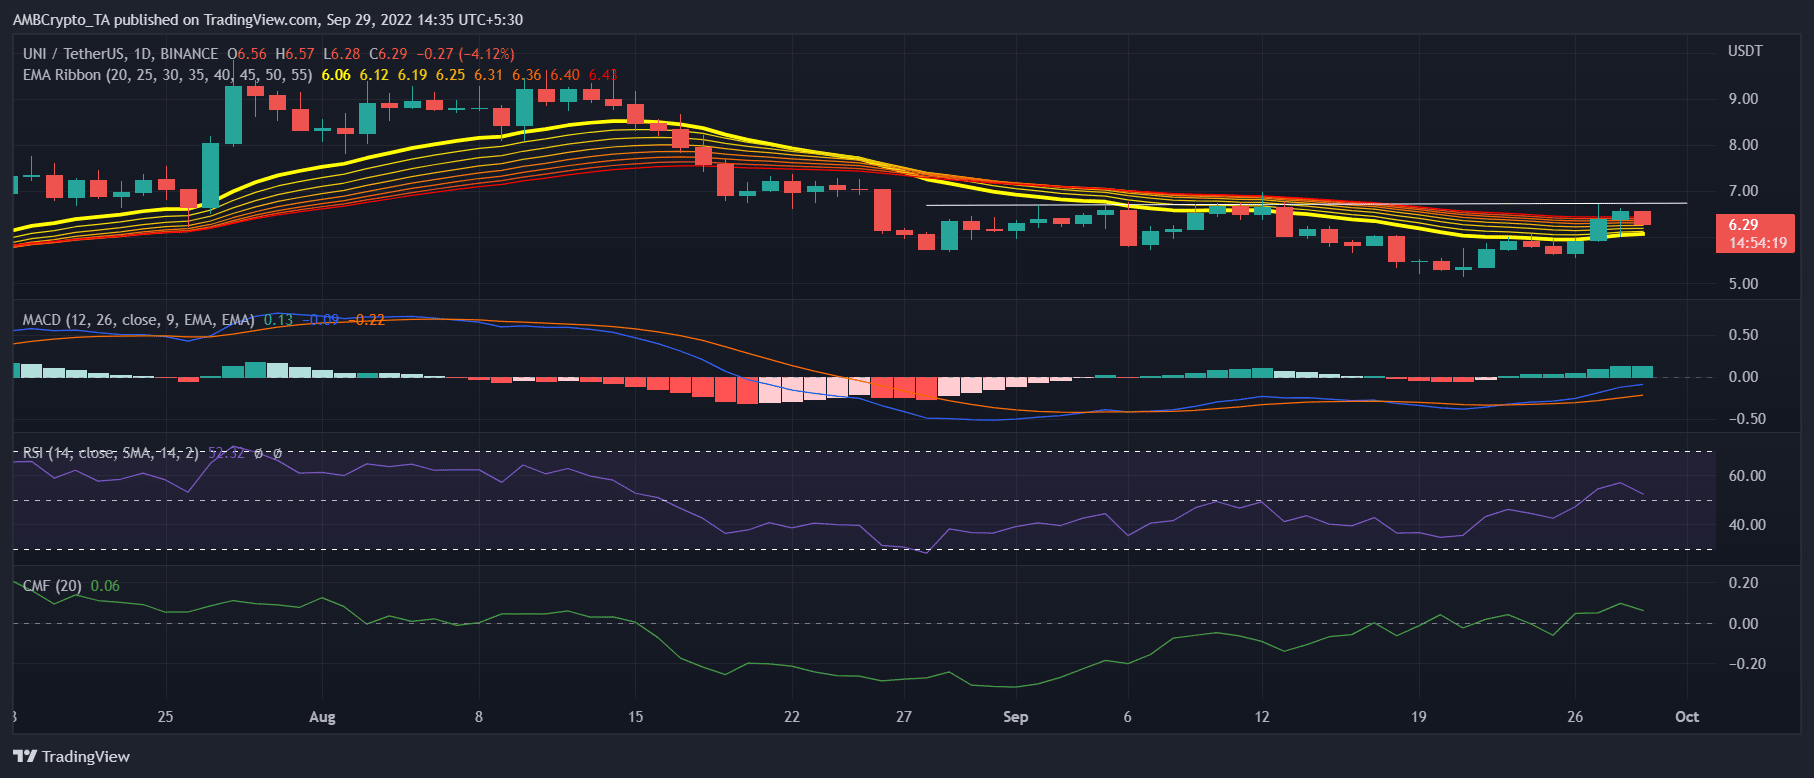
Surprisingly, UNI’s daily chart also revealed the possibility of a trend reversal as most of the market indicators were not in favor of a price surge in the coming days. UNI’s price was around its resistance zone of $6.77, which under general terms would initiate selling pressure and push the price south.
UNI’s Relative Strength Index (RSI) and Chaikin Money Flow (CMF) also registered a move towards the south, suggesting a bear advantage in the market. Moreover, the Exponential Moving Average (EMA) Ribbon projected bear market conditions as the 20-day EMA was below the 55-day EMA.
However, the Moving Average Convergence Divergence (MACD) revealed that a bullish crossover happened recently. Now, while this might help push the price, it will only be for a short period.