


Disclaimer: The information presented does not constitute financial, investment, trading, or other types of advice and is solely the writer’s opinion.
- UNI fronted a rebound at $3.980.
- On-chain metrics indicated that sell pressure was abound.
Uniswap’s [UNI] sellers made 14% shorting gains after devaluing the altcoin from $4.6 to $3.98 in the first half of October. However, bulls re-grouped at $3.98 and attempted a mid-month reversal at press time.
Read Uniswap’s [UNI] Price Prediction 2023-24
AMBCrypto previously marked the $4 psychological level as a crucial rebound area for Uniswap. The projection was confirmed, but UNI’s recovery faced overhead hurdles that traders should note.
UNI’s triple roadblock

The daily chart’s market structure had a bearish bias at press time unless the price exceeded the recent high of $4.68.
The immediate hurdle was at a previous support of $4.2, followed by a daily bearish order block (OB) at $4.29 – $4.43 (red). Above these two obstacles, another roadblock existed at $4.5. The latter is a confluence of daily bearish OB (white) and 50-EMA (Exponential Moving Average).
Since mid-August, capital inflows into UNI’s market weakened, as indicated by CMF below zero. Besides, buying pressure eased in October and remained below the 50-mark. So, the overhead hurdles could prove more challenging for bulls to crack.
Hence, the overhead roadblocks could present shorting opportunities, targeting lower supports.
Uniswap’s development activity dipped as prices dropped
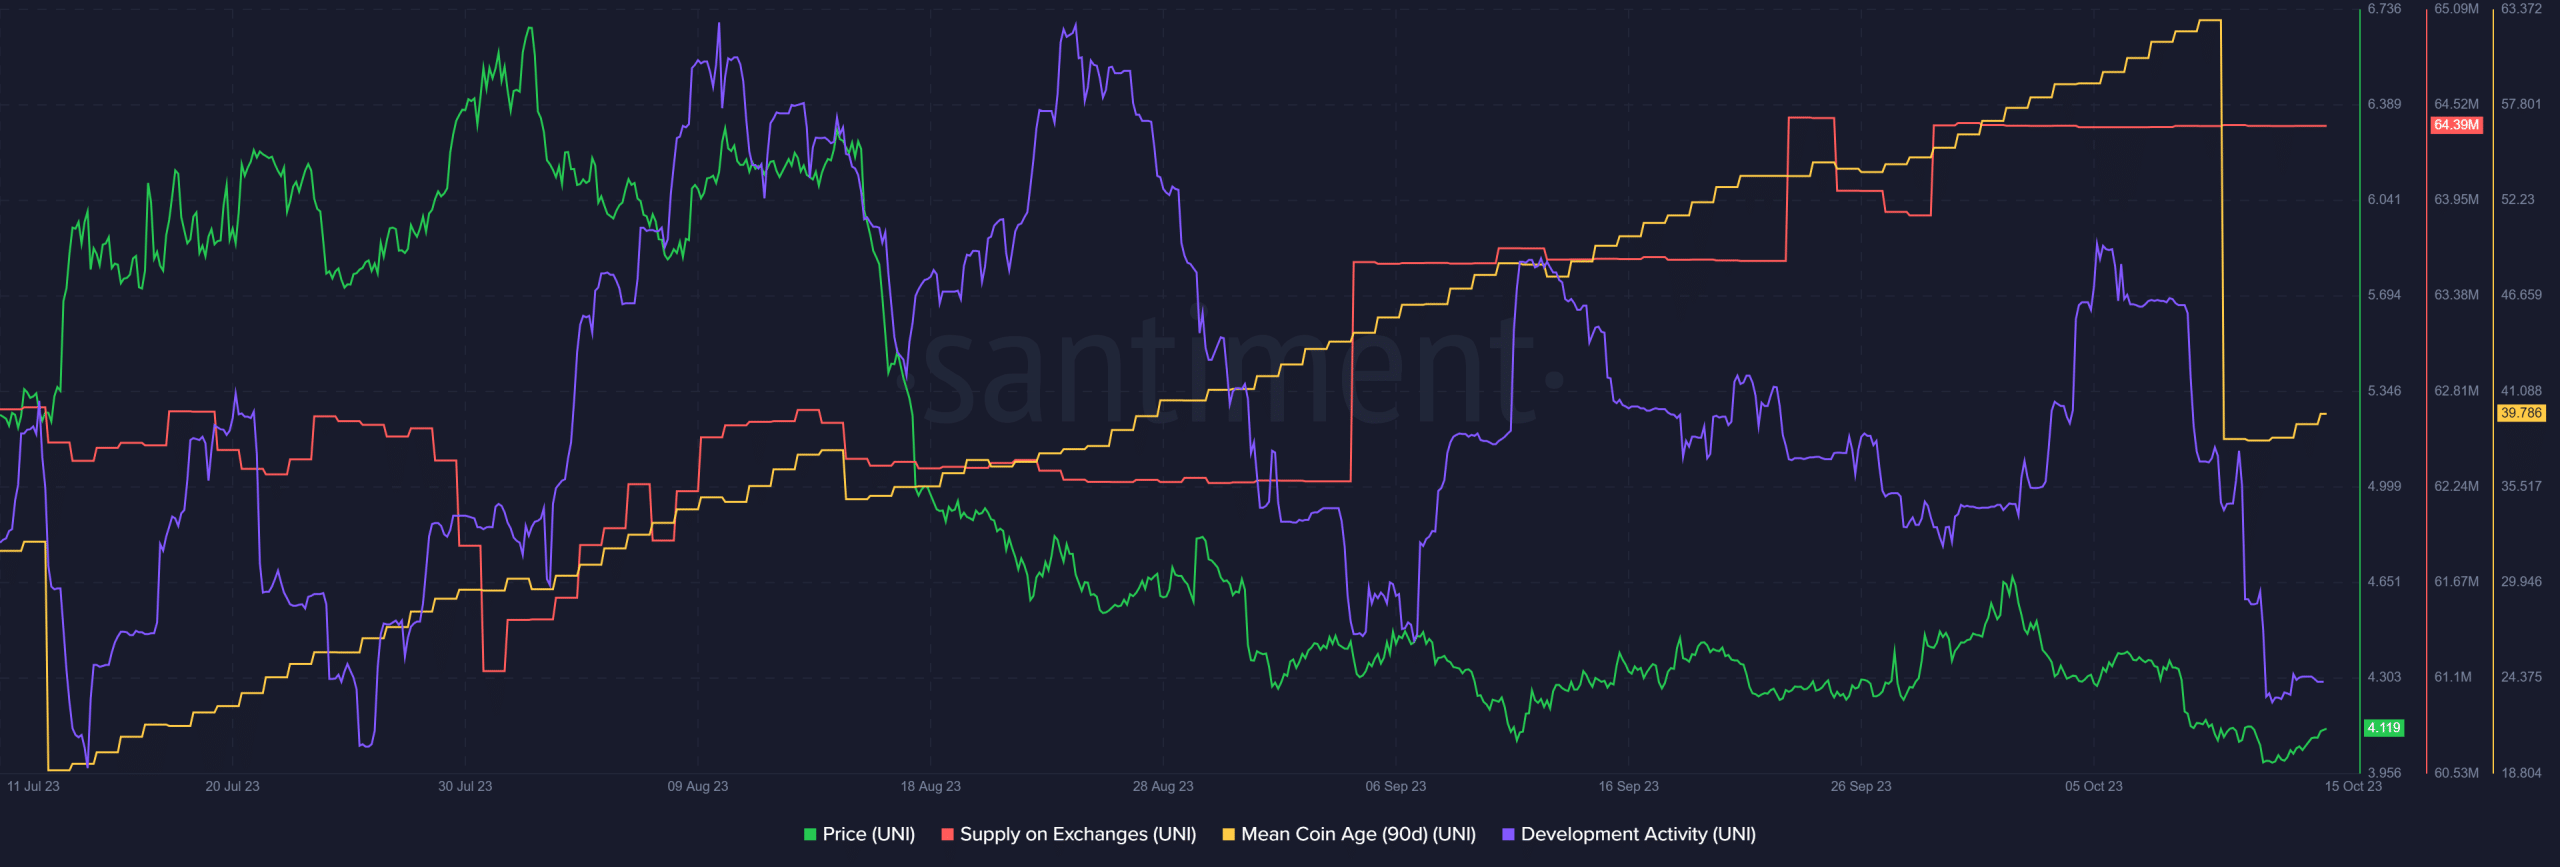
According to Santiment, UNI’s development activity also dropped significantly at the start of Q4, 2023. Over the same time, sell pressure didn’t ease. On the contrary, it increased compared to September, as shown by a spike in Supply on Exchanges.
How much are 1,10,100 UNIs worth today?
The accumulation spree seen since mid-July recorded a sharp distribution on 11 October, as indicated by the 90-day Mean Coin Age massive drop-off.
Although the above metrics attempted reversal at press time, the negative readings could favor sellers. So, the overhead hurdles could attract sellers, especially if BTC posts losses in the next few days.