


Uniswap’s indicators showed a degree of ambiguity and it was uncertain whether the bulls could maintain prices above $31.87 support in the short-term. EOS flashed a bearish market but a fall towards $3.12 support could offer up some buying opportunities for traders. Lastly, stronger cues were needed for BTT to break away from its current channel.
Uniswap [UNI]

Even though Uniswap traded in the green territory at the time of writing, the indicators gave mixed signals on its short-term trajectory. On one side, UNI recaptured the $31.87 level on the back of the bullish sentiment. The MACD line crossed above the Signal line and highlighted the said sentiment. On the other hand, the ADX dropped below 20 and suggested that the uptrend was losing steam even though charts were yet to reflect the same.
The 24-hour trading volumes were negligible as well. The next few sessions could see both sides battle for control and assert their dominance in the market. If the bulls sustain the current level, a rise towards the ATH was not a far-off possibility.
EOS

EOS slipped below the 20-SMA (blue), 50-SMA (yellow), and even the longer-term 200-SMA (green) at press time as bearishness persisted in its market. Losses over the last 30 days now amounted to nearly 17% as EOS failed to establish a recovery since the broader market pullback in late-February.
The OBV showed that buying pressure was inadequate to pump a bullish bounce back on the charts. The Awesome Oscillator indicated that the momentum rested with the selling side. A move below the press time support could see the price slip towards the next line of defense at $3.12. On the plus side, a lower level could offer a discounted price for long-term traders.
BitTorrent Token [BTT]
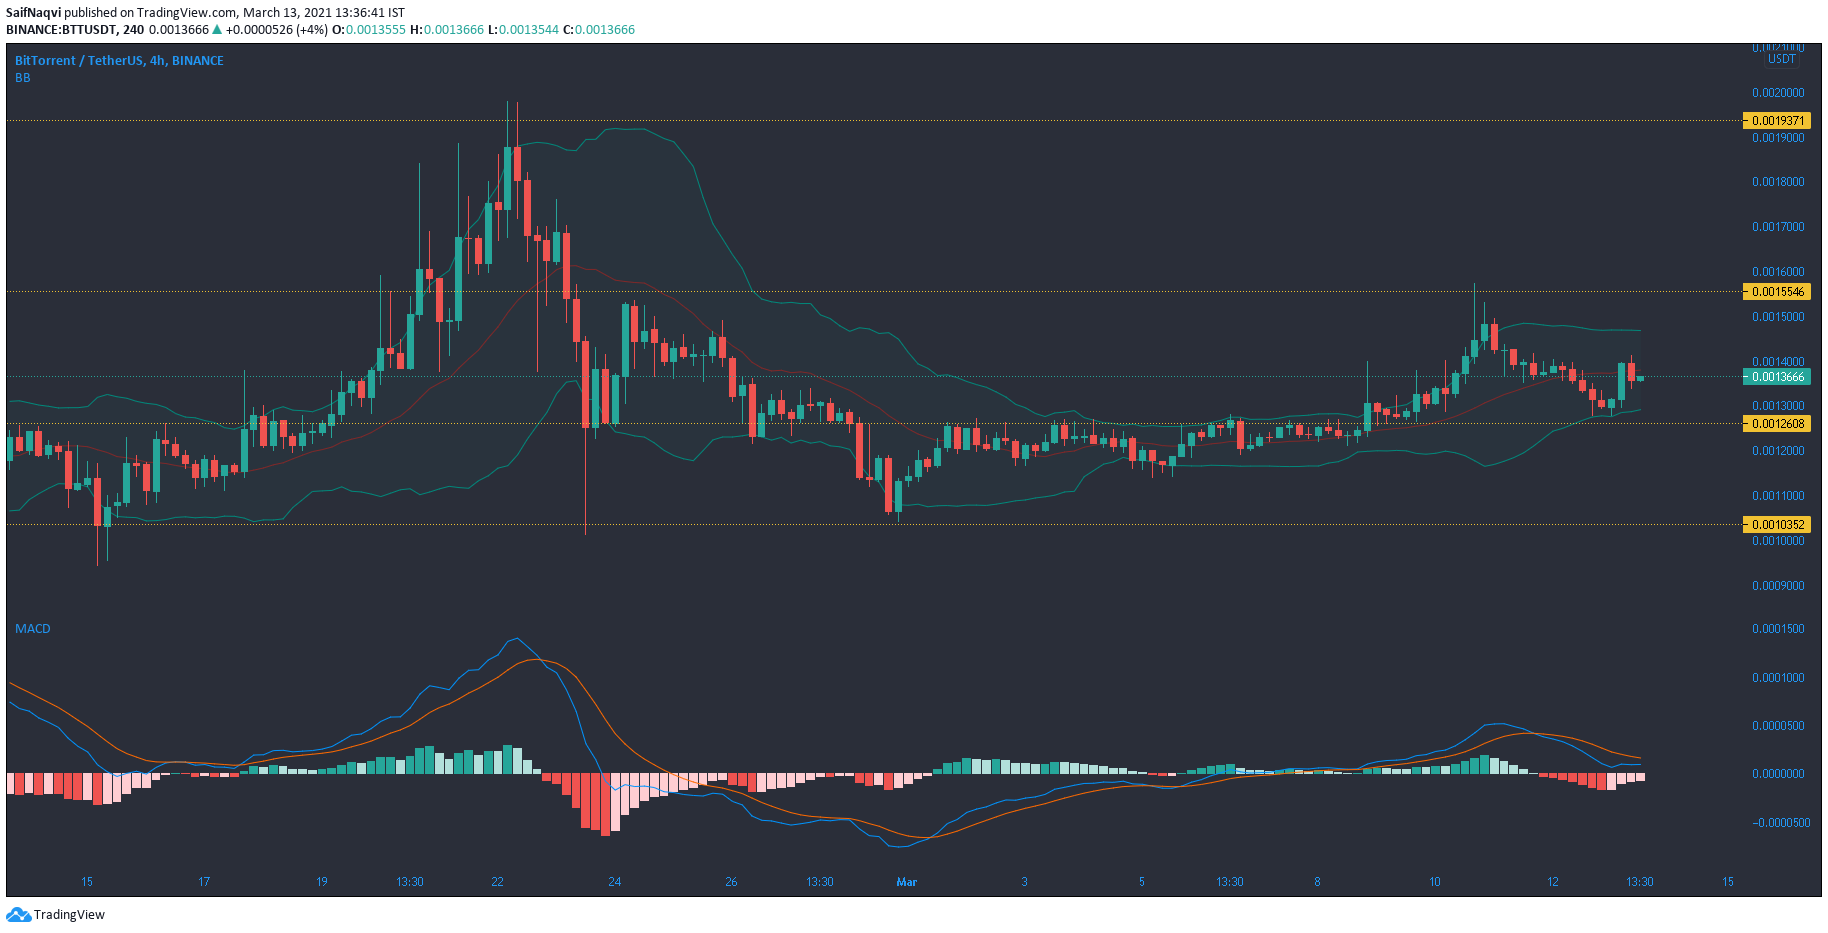
Volatility was on the rise in the BitTorrent Token market according to the Bollinger Bands and so were the trading volumes. The MACD’s histogram noted a fall in bearish momentum while the fast-moving line gained some ground on the signal line. While these were promising indicators, further cues were needed to back a move away from BTT’s present channel, an area that has seen strong price oscillation over the last five days.
If an upwards breakout does occur sooner than expected, the bulls would likely take the price towards $0.0019 resistance. Conversely, a fall below the present support could see BTT challenge the next barrier at $0.0010.