While transforming the broader sentiment is still a dream scenario for the bulls, the near-term technical indicators of Uniswap, Litecoin, and NEAR flashed a slight buying bias.
Uniswap pulled back from its immediate supply zone while Litecoin jumped above its 20/50/200 SMA. NEAR managed to attain its lifetime milestone on 15 January and formed a bullish divergence with its RSI. However, it still needed enough volumes to sustain its edge.
Uniswap (UNI)

Source: TradingView, UNI/USDT
After the $19.89-mark displayed strong resistance, the rising wedge broke down to test the Point of Control (red) multiple times. The 5 January sell-off saw an engulfing red candlestick that propelled an over 26% retracement until its three-week low on 8 January.
As a result, it fell below its Point of Control (red) and marked a down-channel (white) on its 4-hour chart. Over the past week, the alt saw a double-bottom pattern on its 4-hour chart. Consequently, it broke out but again reversed from the $18 supply zone.
Now, to prevent a further downturn, the bulls had to defend the $16.6-mark near the crossover of 20/200 SMA.
At press time, the alt traded at $16.94. The RSI poked its record high at 77.9 on 16 January before a steep plunge toward the midline. It eyed to retest the midline before committing to a trend.
Litecoin (LTC)
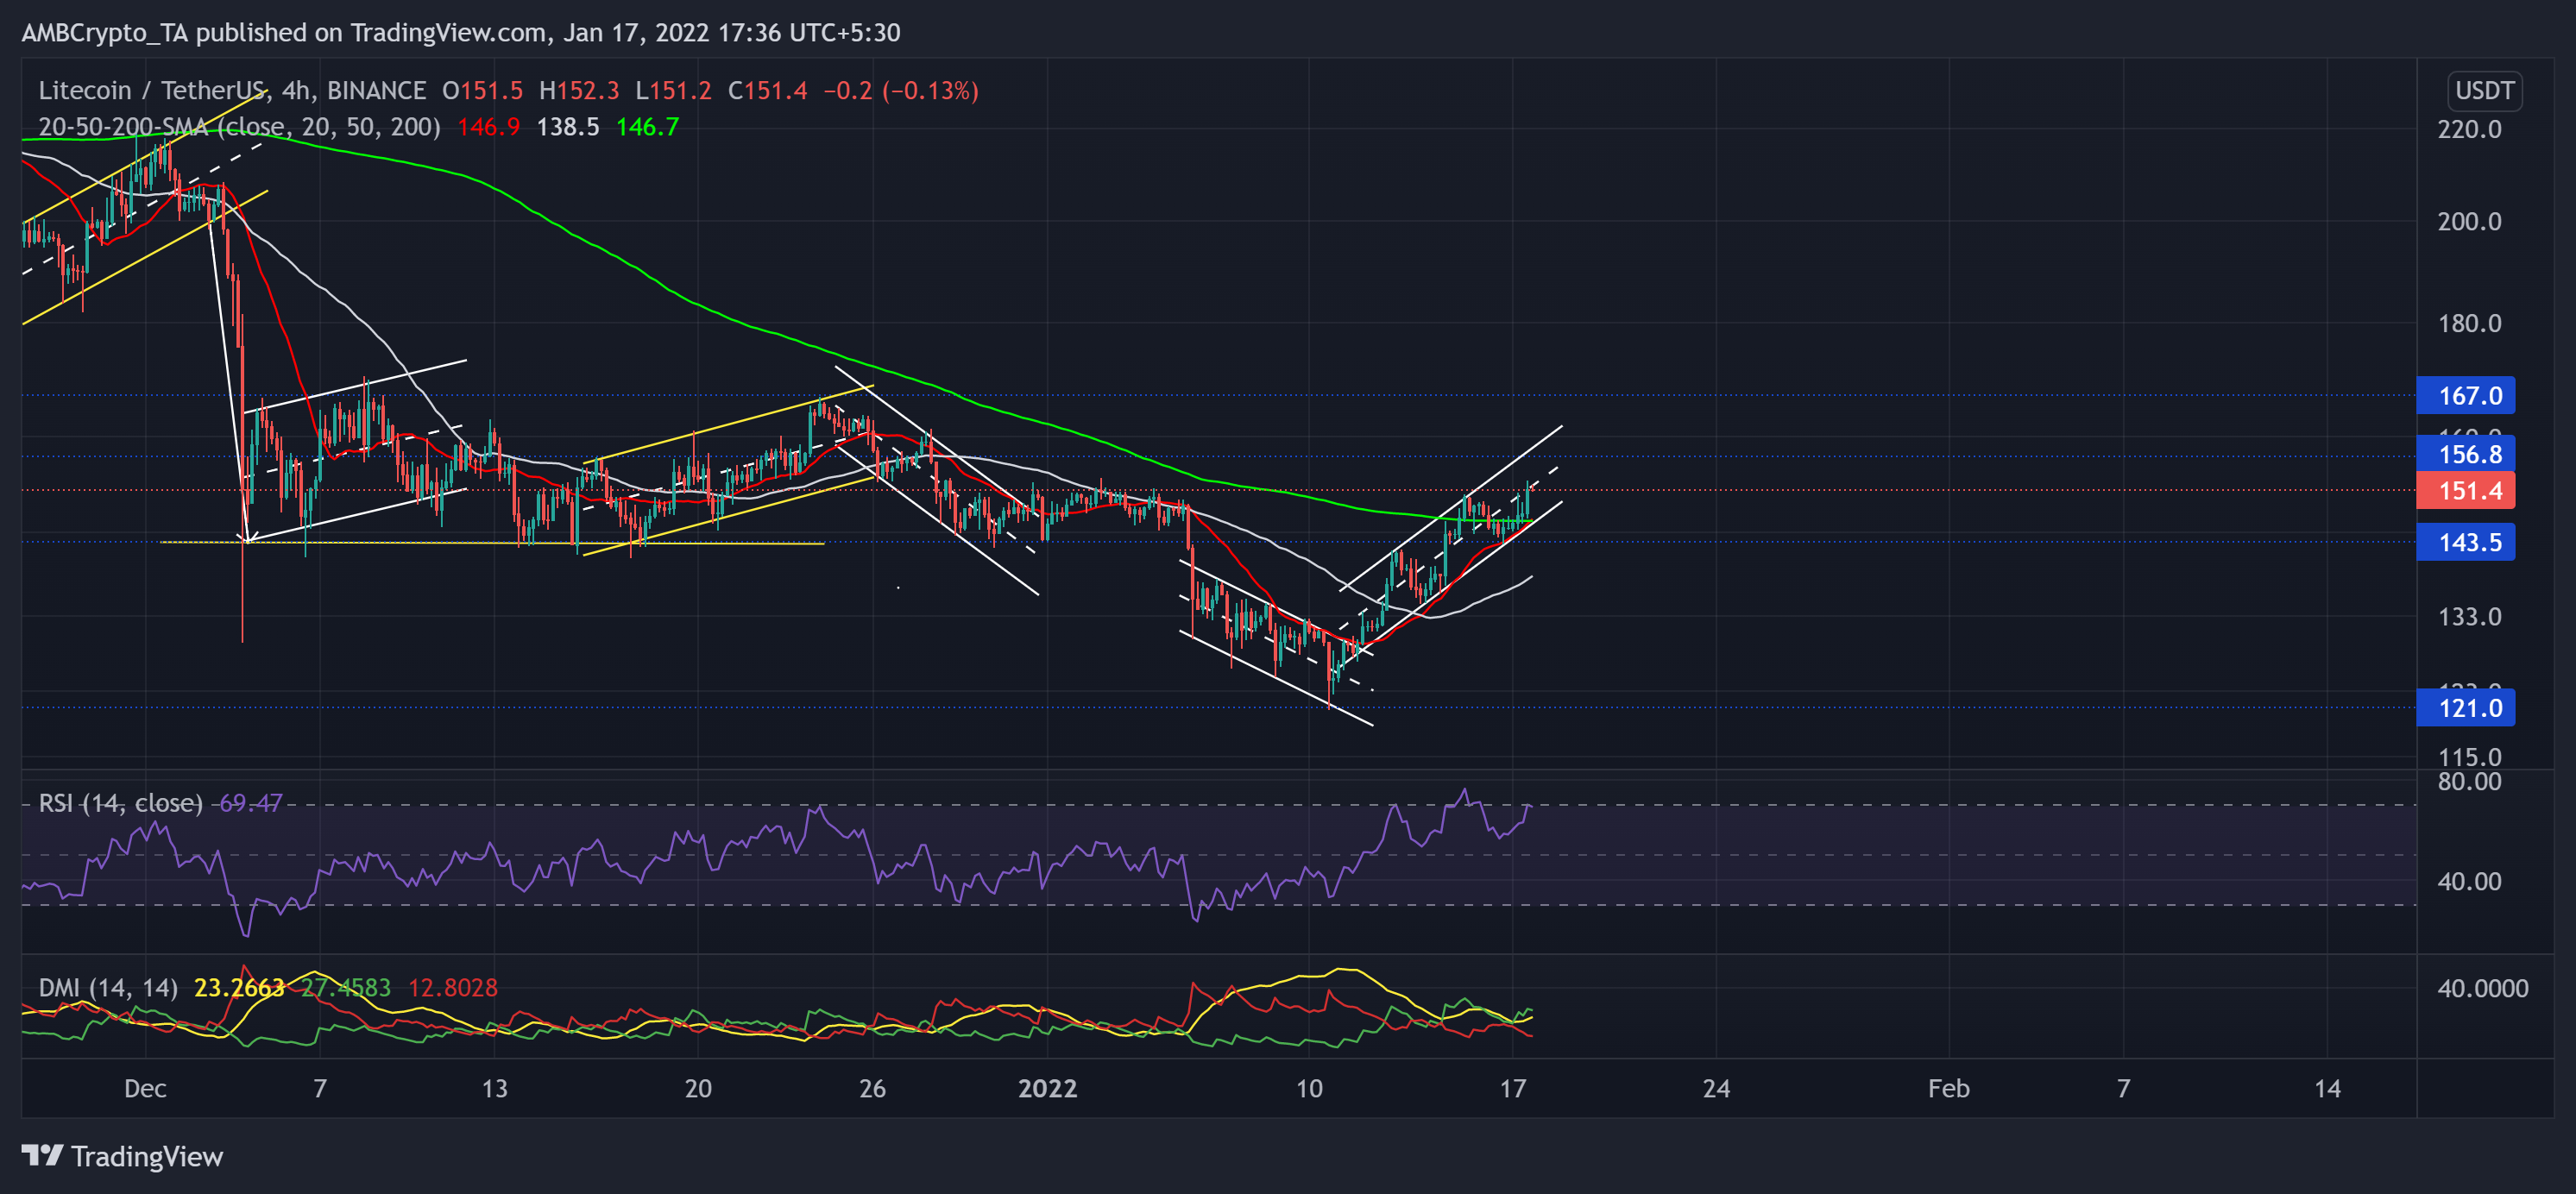
Source: TradingView, LTC/USDT
LTC managed to claw back in an up-channel and reclaim its oscillating range between the $167 and $143-mark. The altcoin saw a 25.7% ROI (from its five-month low on 10 January) until press time. Meanwhile, the bulls managed to flip the vital $143-reistance as support.
With this jump, LTC found itself above the 20/50/200 SMA. At press time, LTC traded at $151.4.
The RSI headed to test the overbought territory for the third time in the last five days. It flashed a one-sided bullish preference. Furthermore, the DMI reaffirmed the bullish vigor. But the ADX displayed a weak directional trend for the alt.
Near protocol (NEAR)
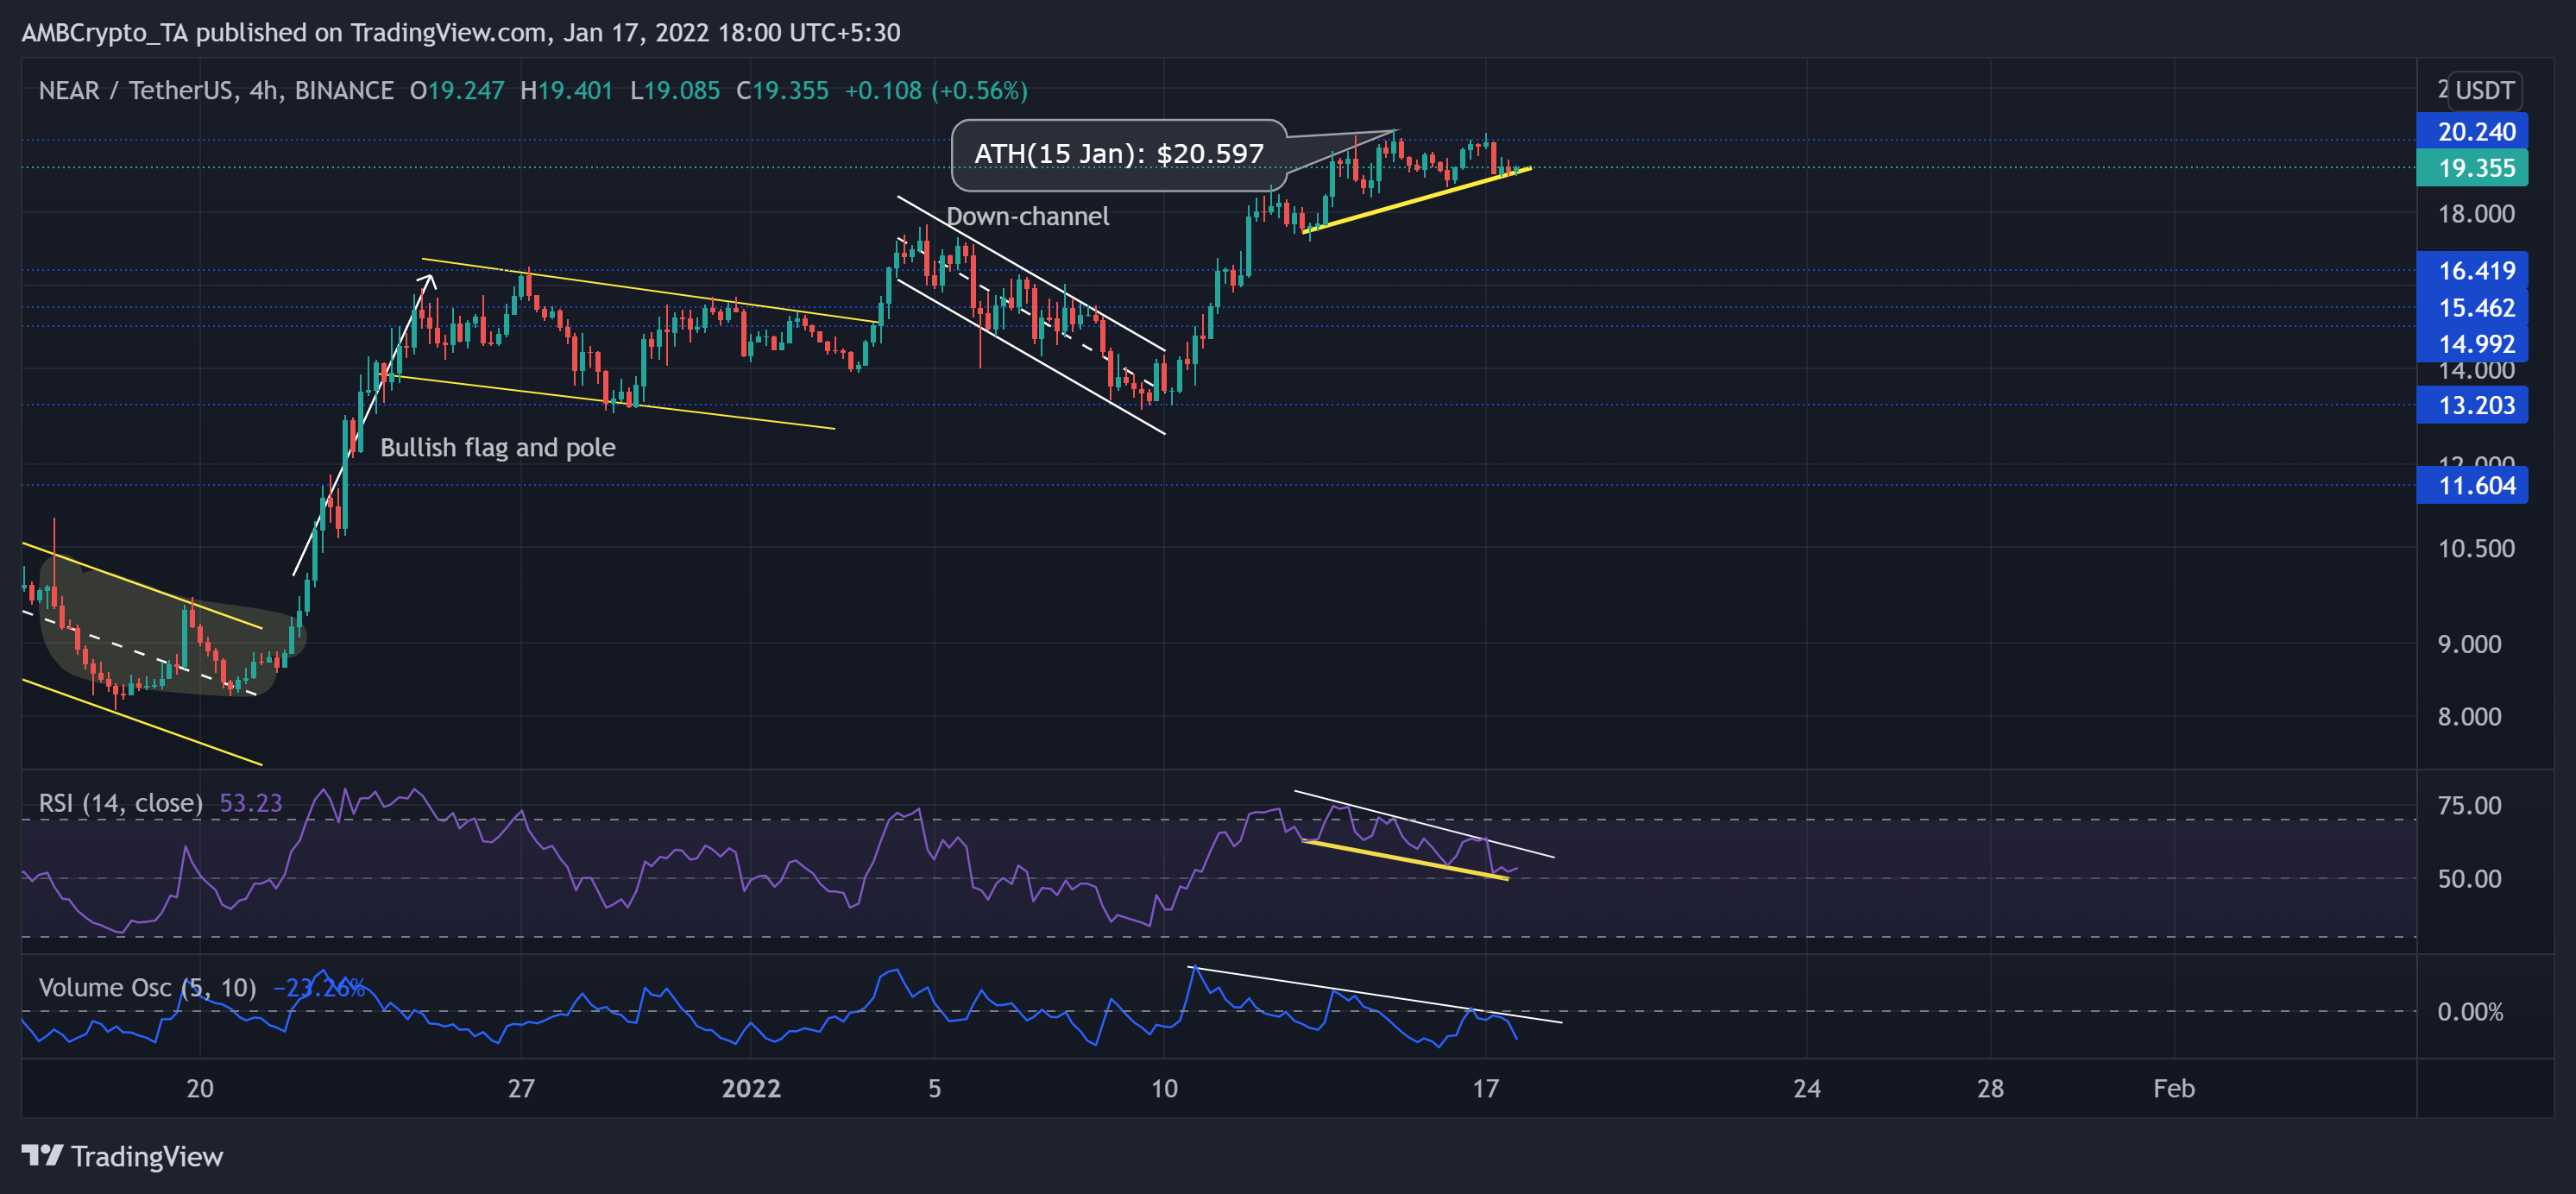
Source: TradingView, NEAR/USDT
After an inverse head and shoulder on its RSI, NEAR marked exponential gains by forming a bullish flag and pole on its 4-hour chart. It saw an exceptional 147.57% ROI (from 20 December low) to poke its ATH at $20.597 on 15 January.
As the down-channel (white) oscillation halted at the $13.2-mark support, NEAR saw a patterned breakout and entered into price discovery.
At press time, the alt traded at $19.335. The RSI formed a down-channel and seemed to slow down around the midline. It still managed to flash a slight bullish bias. Furthermore, it still marked a hidden bullish divergence (yellow trendline) with the price. However, it becomes crucial to note that the Volume Oscillator marked lower peaks, hinting at a weak bullish rally.