


For Uniswap, lower timeframes showed a shift in momentum in favor of the bulls. This could see UNI climb higher and reach $29.45, and possibly even test resistance at $29.56. The reaction of the price at its next resistance level will be important in the short-term, and climbing above this level would make recovery toward $32 more likely in the coming days. Rejection at $29.56 would see UNI drop back toward $26.
Uniswap 1-hour chart
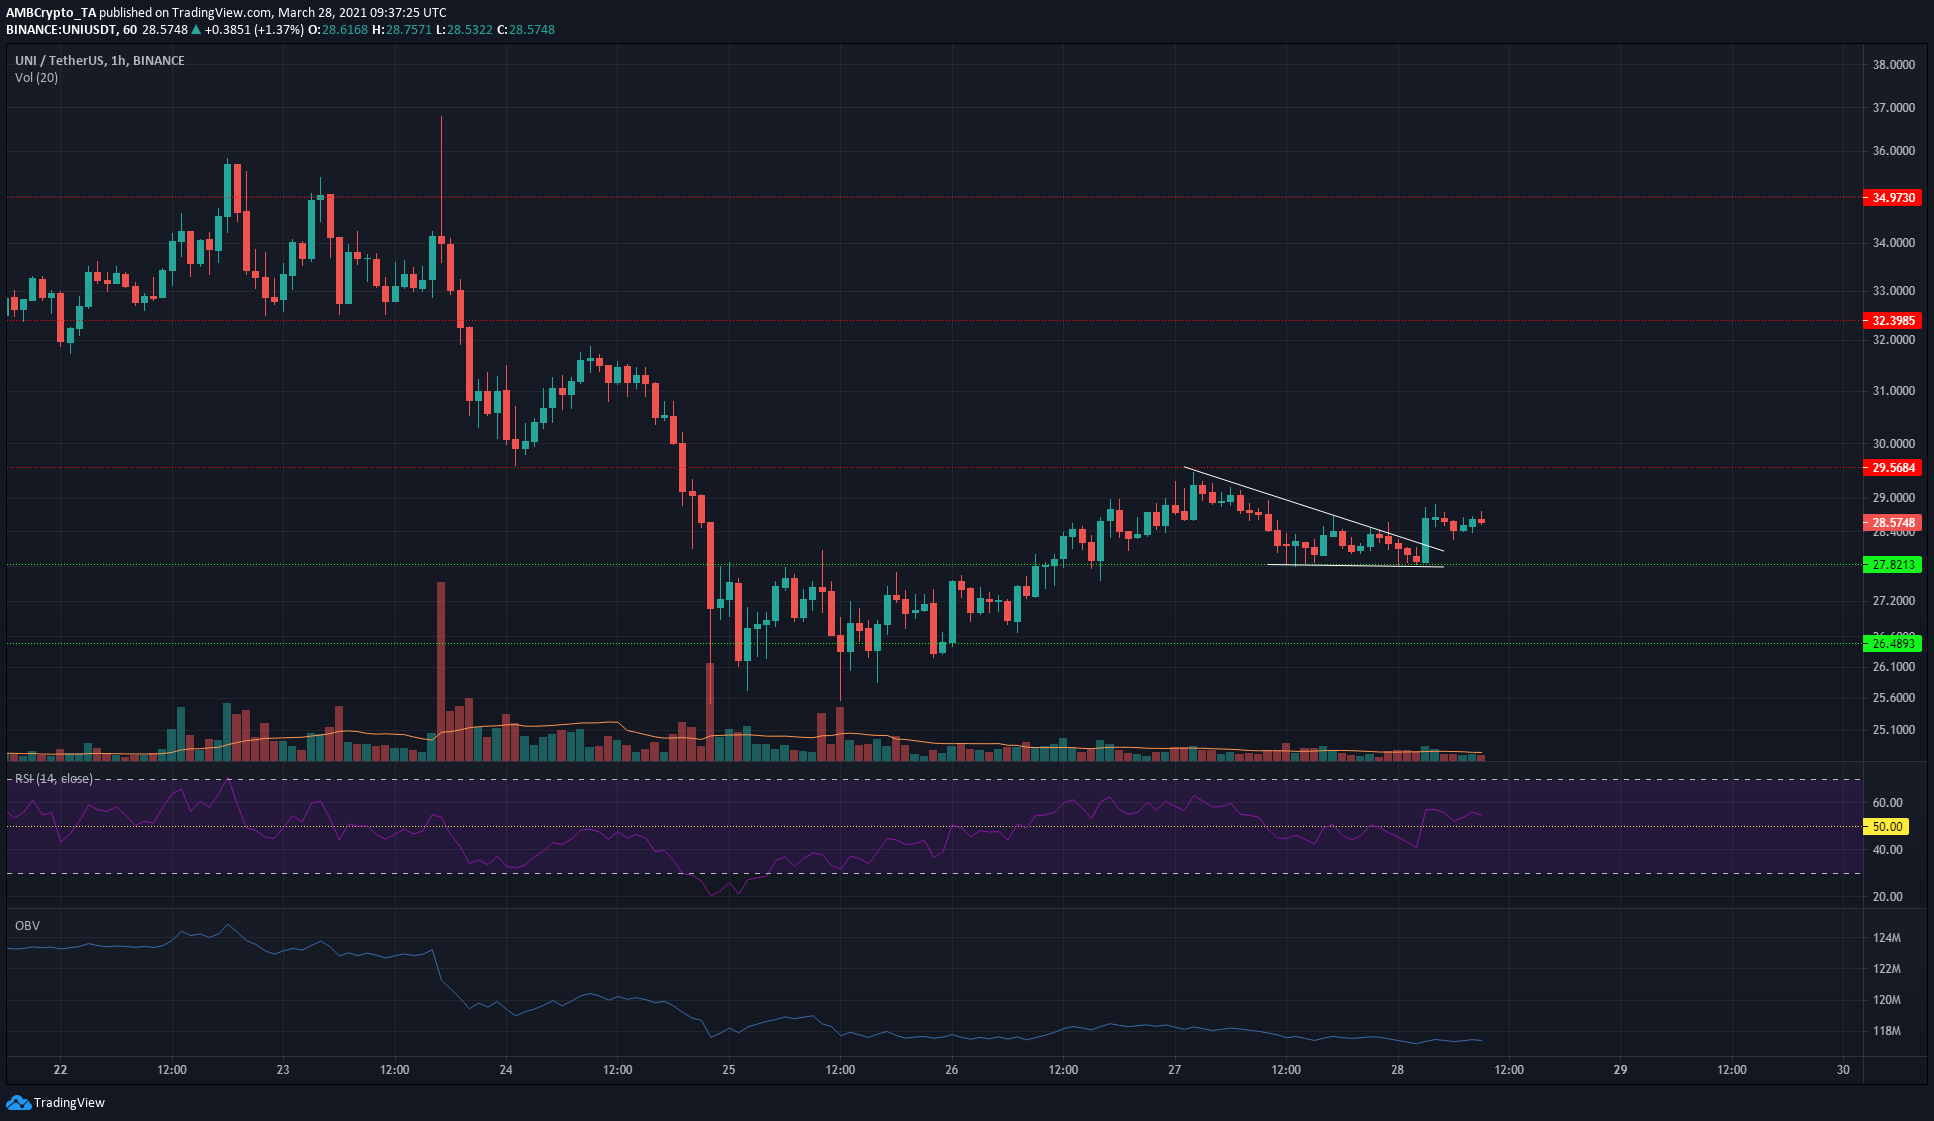
On the hourly chart, UNI formed a descending triangle and broke out upward. This move was not on heavy trading volume, marking it as slightly suspicious. The target of $29.45 was presented to UNI bulls following the breakout, with a level of resistance at $29.56 as well.
There was a lack of buyers behind UNI from its bounce from $26.1 to $28.5. The $28.4-$28.8 is a region of supply as well, based on historical trading activity in this zone. A climb above $29.5 would be necessary for UNI to present buying opportunities, while a revisit to $27.8 could also see buyers step in.
Reasoning
RSI climbed above neutral 50 and was at 55 to show a slight leaning to the bullish side, but this wasn’t a sign of bullish strength yet. OBV continued to trend downward even as the price recovered from the $26.1 lows.
Defending the $26 level in the past few days and effecting a bounce was a sign of waning bearish pressure in the short-term. The triangle pattern set a technical target of $29.45; however, there was no evidence across multiple timeframes that supported a move past the $29.56 resistance level.
Conclusion
Longer timeframes showed that although bearish sentiment was waning, buying pressure was lacking as well. Taken together, a rejection at $29.5 and a revisit to $27.8 could be seen over the next few hours.