Uniswap’s next bull rally may be delayed despite all these odds in UNI’s favor

Uniswap [UNI] made headlines as it stood to be the highest revenue-generating protocol as of 6 November. Furthermore, things also looked quite optimistic for the blockchain owing to a few other positive developments.
.@Uniswap is the highest revenue-generating protocol in crypto.
However, @Curve, an Automated Market Maker (AMM) focused on "like-like" pools has a higher TVL.
Why is this the case?👇 pic.twitter.com/DESNRYzoh3
— Messari (@MessariCrypto) November 6, 2022
_____________________________________________________________________________________
Here’s AMBCrypto’s Price Prediction for Uniswap [UNI] for 2023-24
_____________________________________________________________________________________
According to crypto whale tracking platform WhaleStats, UNI was a point of interest for the whales as well. At the time of writing, UNI stood among the list of cryptos that the top 1000 Ethereum whales were holding.
https://twitter.com/WhaleStats/status/1589098007835934720?s=20&t=92z4f_WSwESShHu-SHPoJw
All these developments also reflected on Uniswap’s chart, as it registered more than 5% weekly gains. As per CoinMarketCap, UNI’s press time price was $7.58 with a market capitalization of $5,778,307,914. Interestingly, a look at UNI’s metrics also favored the investors.
Optimistic possibility
Uniswap, recently announced that Uniswap v3 was live on five different chains. This could be considered as positive news that could have the potential to push UNI’s price up.
Uniswap v3 is live on 5 different chains!
Check out how our refreshed interface changes as you toggle between them with just one click 😍https://t.co/JTiOmVWZl9 pic.twitter.com/BkRgr43YjP
— Uniswap Labs 🦄 (@Uniswap) November 3, 2022
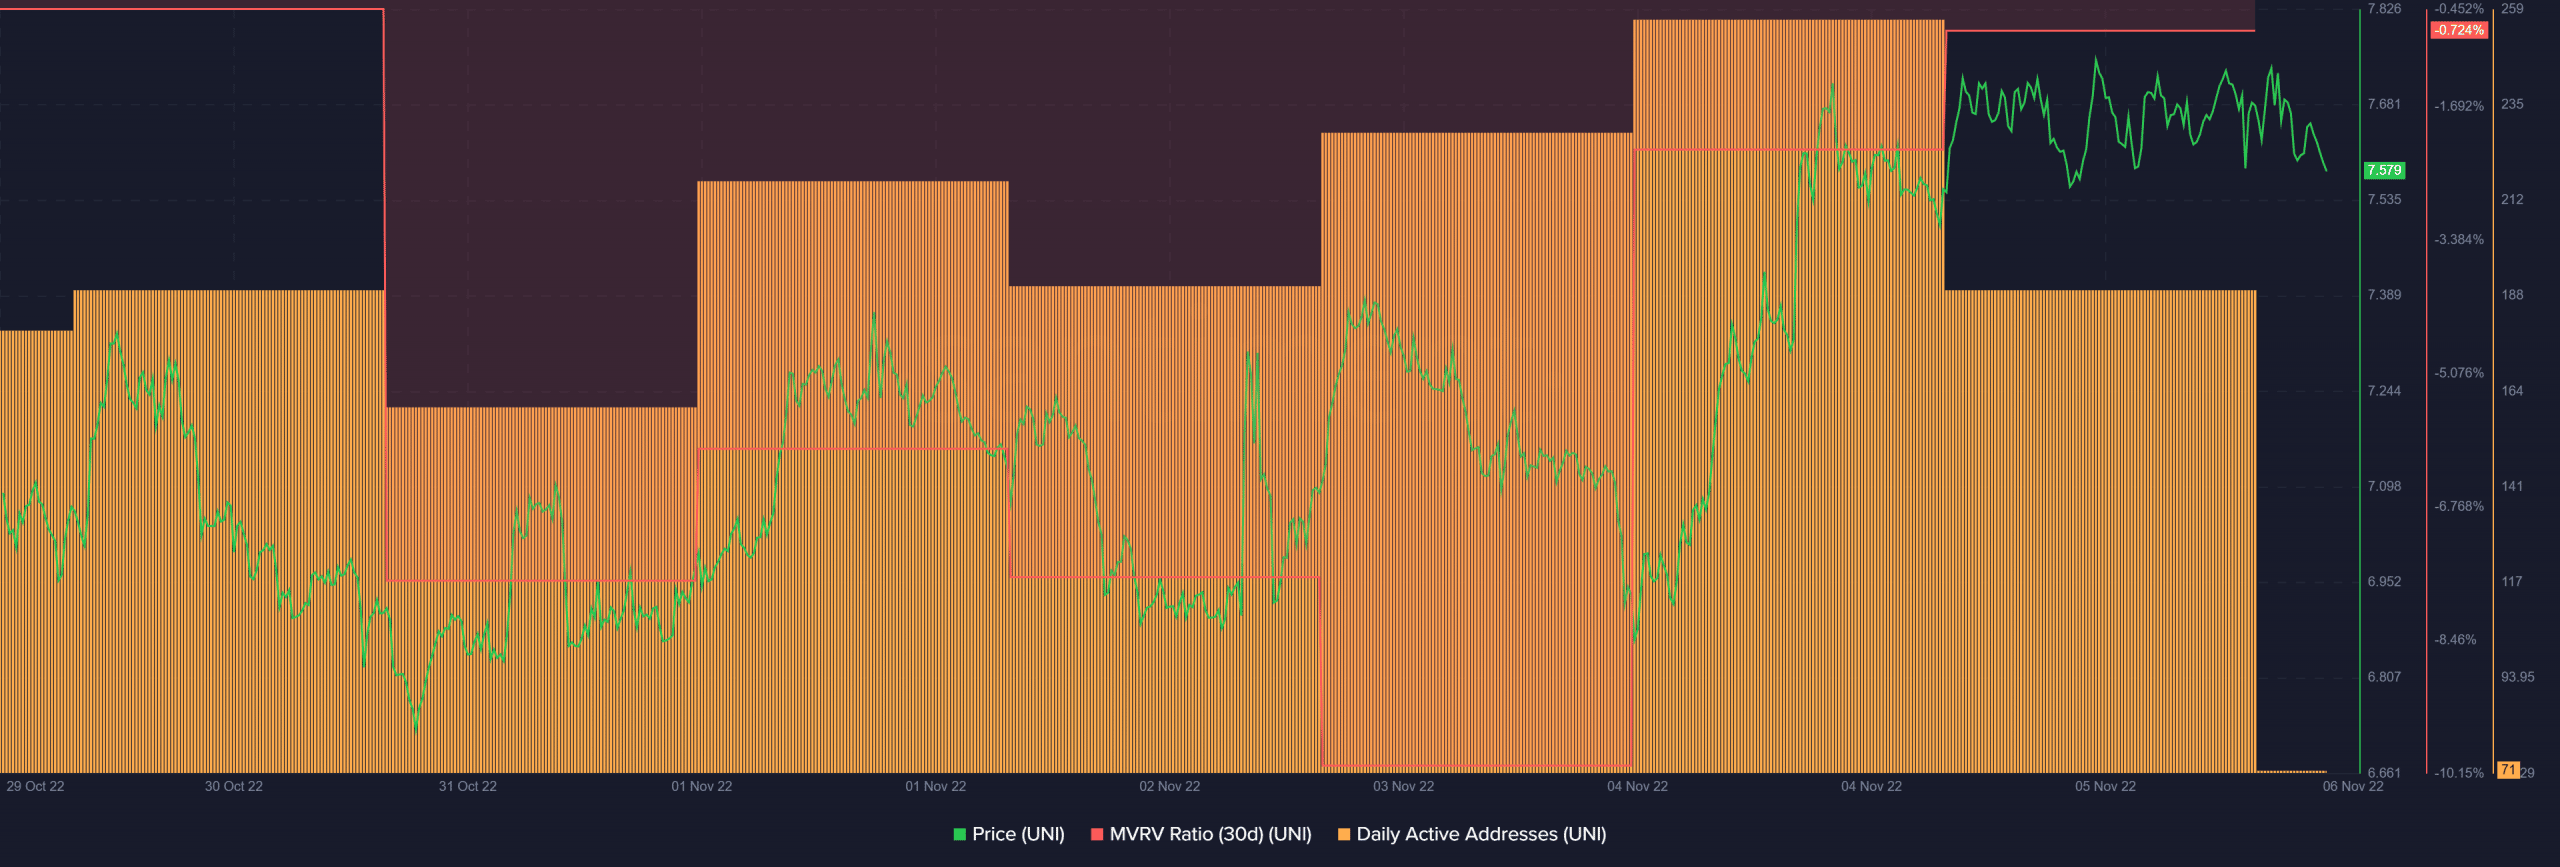
Furthermore, data from analytical platform Santiment revealed that UNI’s Market Value to Realized Value (MVRV) ratio was up. This indicated a price surge in the coming days. Not only this, but UNI’s daily active addresses also registered an uptick on 4 November.
The surge in active addresses reflected an increased number of users on the network. UNI’s network growth also followed the same route and spiked lately. However, at the time of writing, the net for both marked a slight decline.
Nonetheless, not everything was working in UNI’s favor. Data from CryptoQuant’s told a different story. For instance, UNI’s exchange reserves were increasing, a negative signal as it indicated higher selling pressure.
Furthermore, UNI’s Relative Strength Index (RSI) was in an overbought position. This increases the possibility of a price plummet in the days to come.
A clear ending from a not-so-clear scenario?
UNI’s daily chart showed an ambiguous picture as a few market indicators suggested a price hike while the others indicated otherwise. The Exponential Moving Averages (EMA) Ribbon displayed that the buyers had an advantage in the market as the 20 day EMA was resting well above the 55 day EMA.
Interestingly, UNI’s Money Flow Index (MFI) and Chaikin Money Flow (CMF) both registered downticks. These indicators were heading towards the neutral positions, a strong bearish signal. Therefore, considering all the aforementioned data, it is only time to answer which way UNI will head in the coming days.


