
- POL’s active addresses and transactions dropped in Q3.
- POL was also facing trouble, as it was down by 13% last week.
Polygon [POL] underwent a major upgrade in the last quarter, bringing several changes to the blockchain.
AMBCrypto assessed the blockchain’s performance in Q3 2024 to understand whether the upgrade had any impact. We then also checked how the token’s price was affected.
Polygon’s decline in Q3 2024
A major development that happened in the last quarter was the upgrade of MATIC to POL. To be precise, POL officially launched on the 4th of September.
As AMBCrypto reported earlier, the upgraded token, POL, will be used as a gas token for the Polygon ecosystem.
That did happen after the upgrade, but things didn’t get better for the blockchain. Messari recently posted an analysis highlighting Polygon’s performance in Q3.
AMBCrypto’s look at that analysis revealed that Polygon’s performance dropped. Most of the metrics dropped last quarter, which clearly reflected a decline in network activity.
For instance, Polygon’s daily active addresses dropped from 1200k in Q2 to 863k in Q3. Similarly, the blockchain’s transactions also dropped by nearly a million.
In Q2, the blockchain’s average daily transaction was 4.1 million, which dropped to 3.2 million in Q3. Polygon’s development also dropped considerably in the last quarter.

Source: Messari
Will Q4 be different?
AMBCrypto then checked Artemis’ data to find out whether network activity was rising in Q4.
We found that after a steady increase till the 18th of October, POL’s daily active addresses started to decline. The blockchain’s daily transactions also followed a similar trend.
However, things in terms of captured value looked good. This was the case as both POL’s fees and revenue increased in October.

Source: Artemis
Amidst all this, POL bears were not in the mood to let go of their advantage. For instance, POL was down by more than 13% last week.
In the last 24 hours alone, the token witnessed a 6% price correction. At press time, POL was trading at $0.3257 with a market capitalization of over $2.5 billion.
These consecutive price drops have pushed POL down to the 33rd spot on the list of cryptos in terms of market cap.
AMBCrypto then planned to check POL’s daily chart to find out whether there were chances of a trend reversal. As per our analysis, the MA cross indicator displayed a bearish crossover.
Is your portfolio green? Check out the POL Profit Calculator
Additionally, the distance between the 21-day MA and the 9-day MA was widening, further suggesting a continued price decline. Nonetheless, POL’s Relative Strength Index (RSI) was in the oversold zone.
Whenever that happens, it indicates that buying pressure might increase, which might result in a price increase soon.
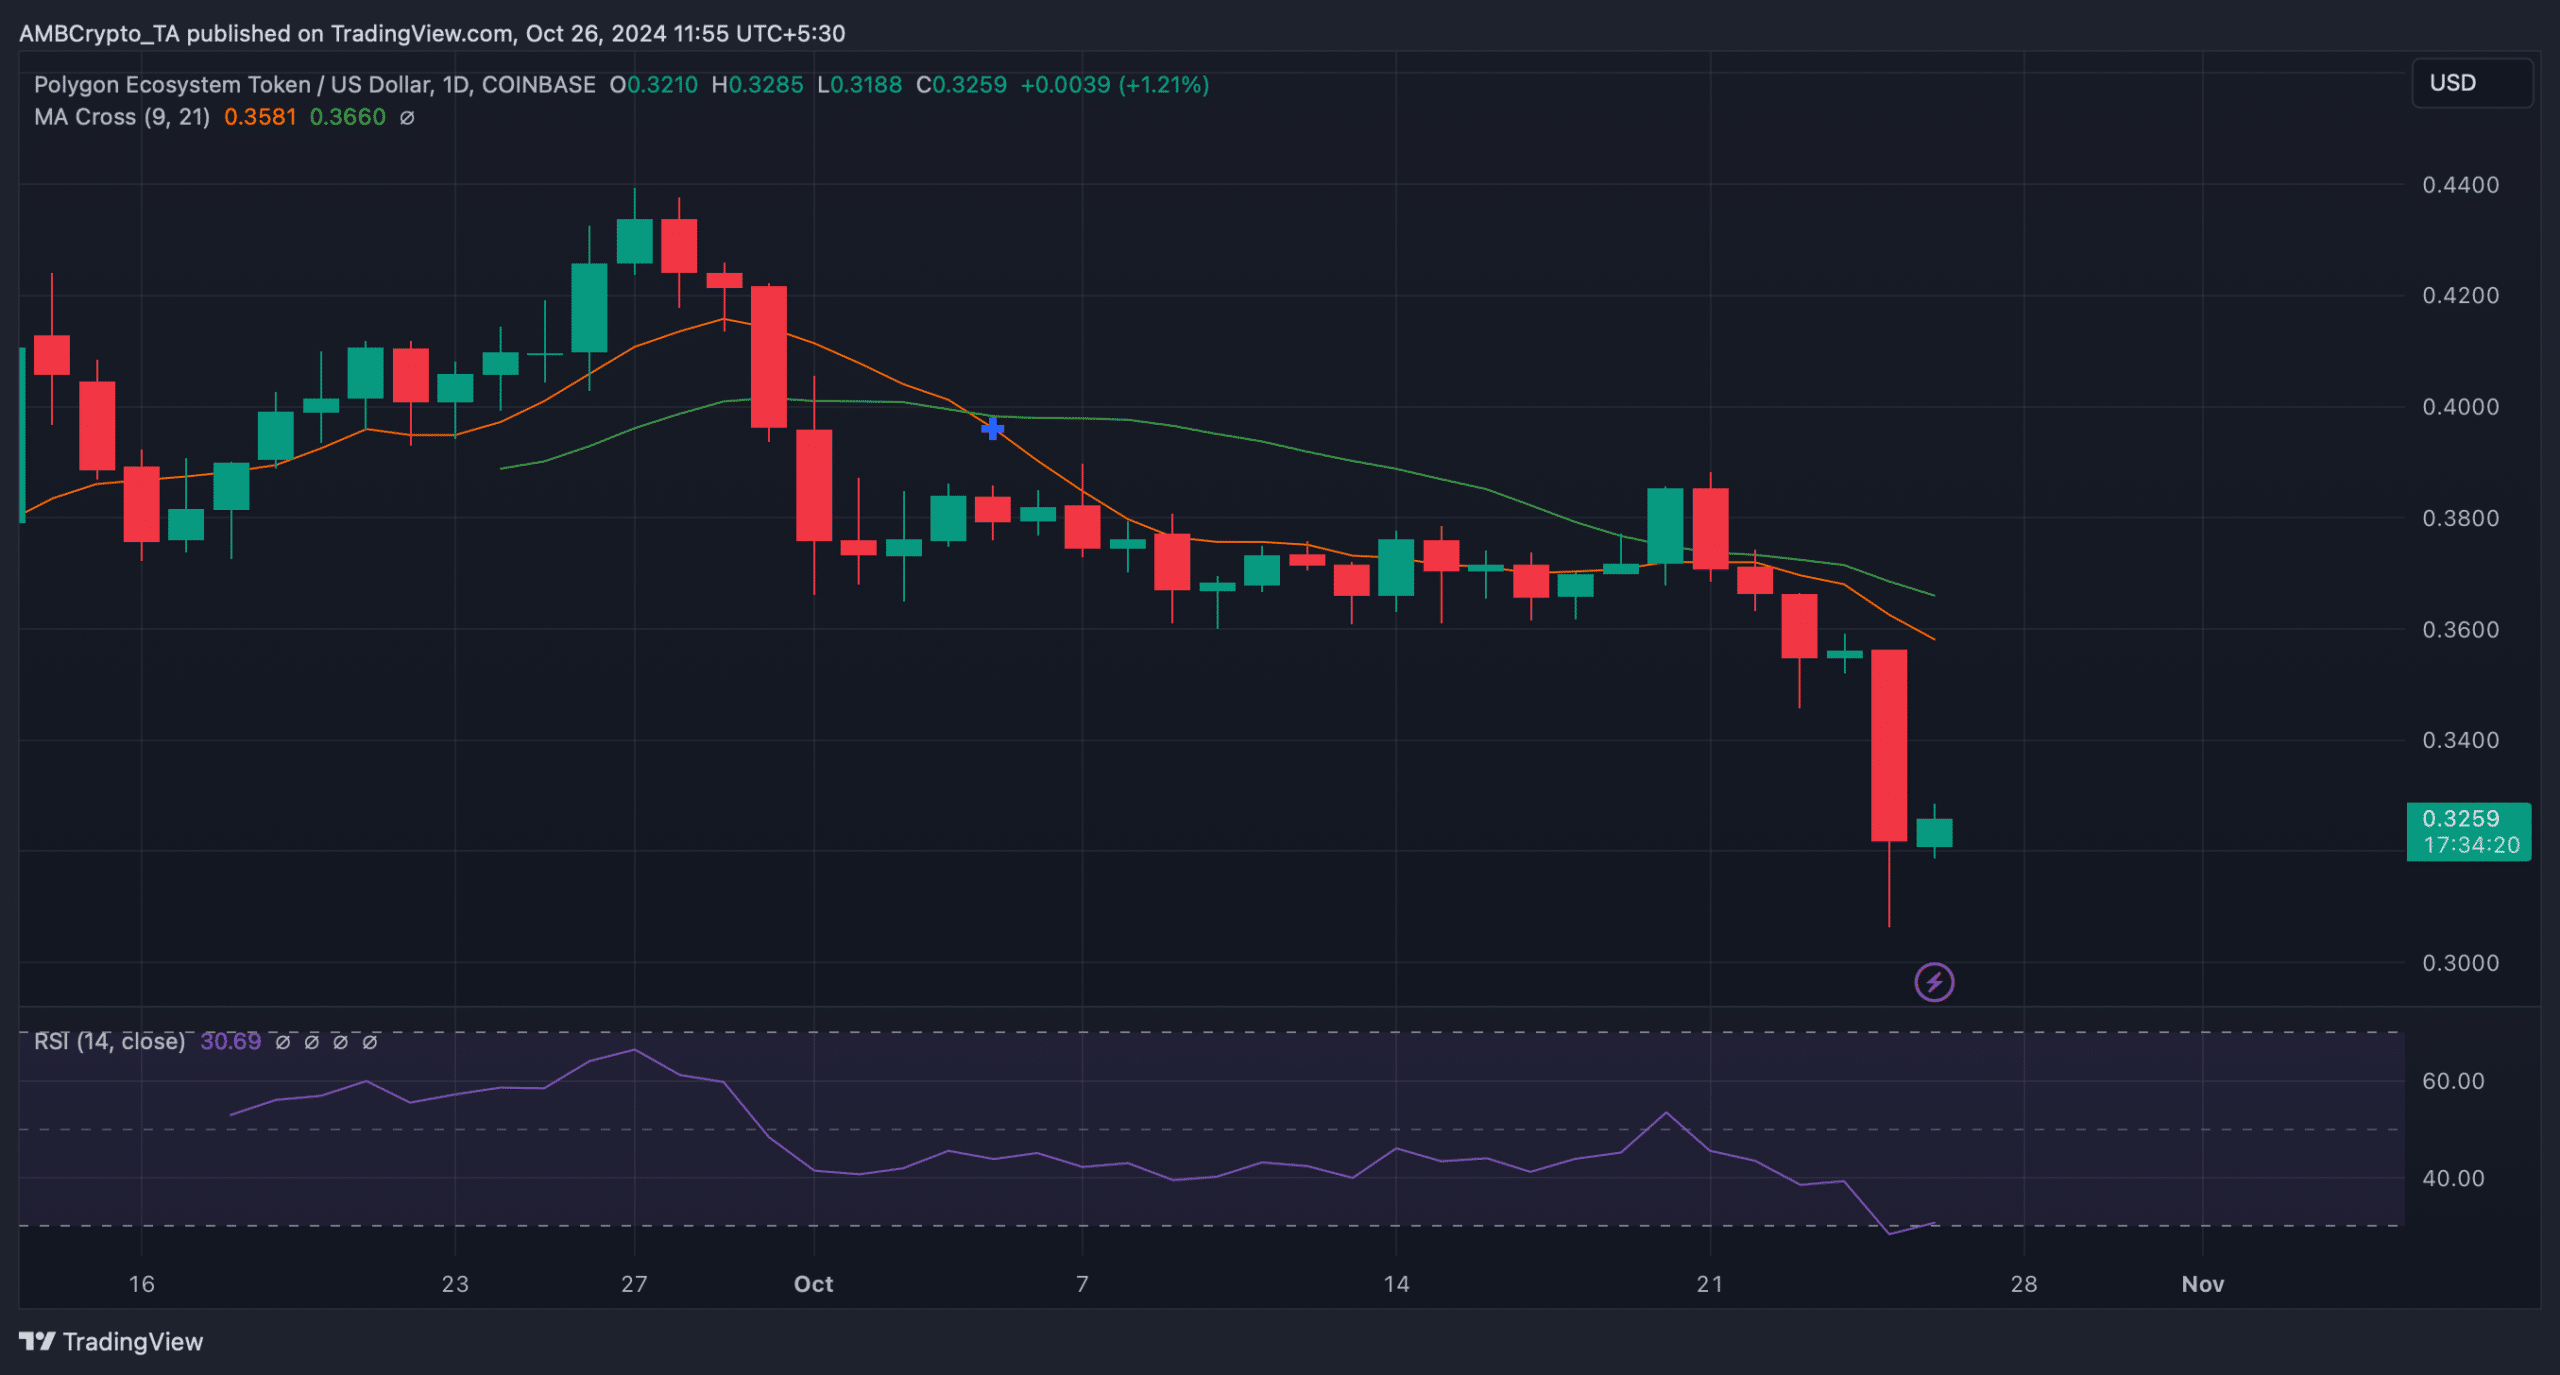
Source: TradingView