Unwinding the after-effects of the latest run on SAND’s technicals

Disclaimer: The findings of the following analysis are the sole opinions of the writer and should not be considered investment advice
After the EMA ribbons denied all buying retrieval attempts over the last six weeks, SAND bears pulled the altcoin down to its $1.11 lows last week. This devaluation has impaired the bullish capability to find a convincing close above its Point of control (red, POC).
Any close below its current pattern would open a doorway towards the $1.11-mark retest, before the bulls consolidate their position.
At press time, SAND was trading at $1.2721, down by 7.95% in the last 24 hours.
SAND Daily Chart

Since its ATH, the bears have persistently marked lower peaks and troughs while the bulls succumbed to broader liquidations. After oscillating within a down-channel (yellow) for over five months, the bears yet again propelled a robust selling spree.
Consequently, SAND was down by nearly 61.34% (from 5 May) and dropped to hit its six-month low on 12 May. With the price action taking a constant bruise, the gap between the EMA ribbons registered a record high.
The next few candlesticks could shape the incoming trend for the altcoin. The current bearish pennant setup would likely work in favor of the bears. While the POC and the 23.6% Fibonacci resistance keep posing hurdles, the bulls still need to reignite their long-lost vigor.
Rationale
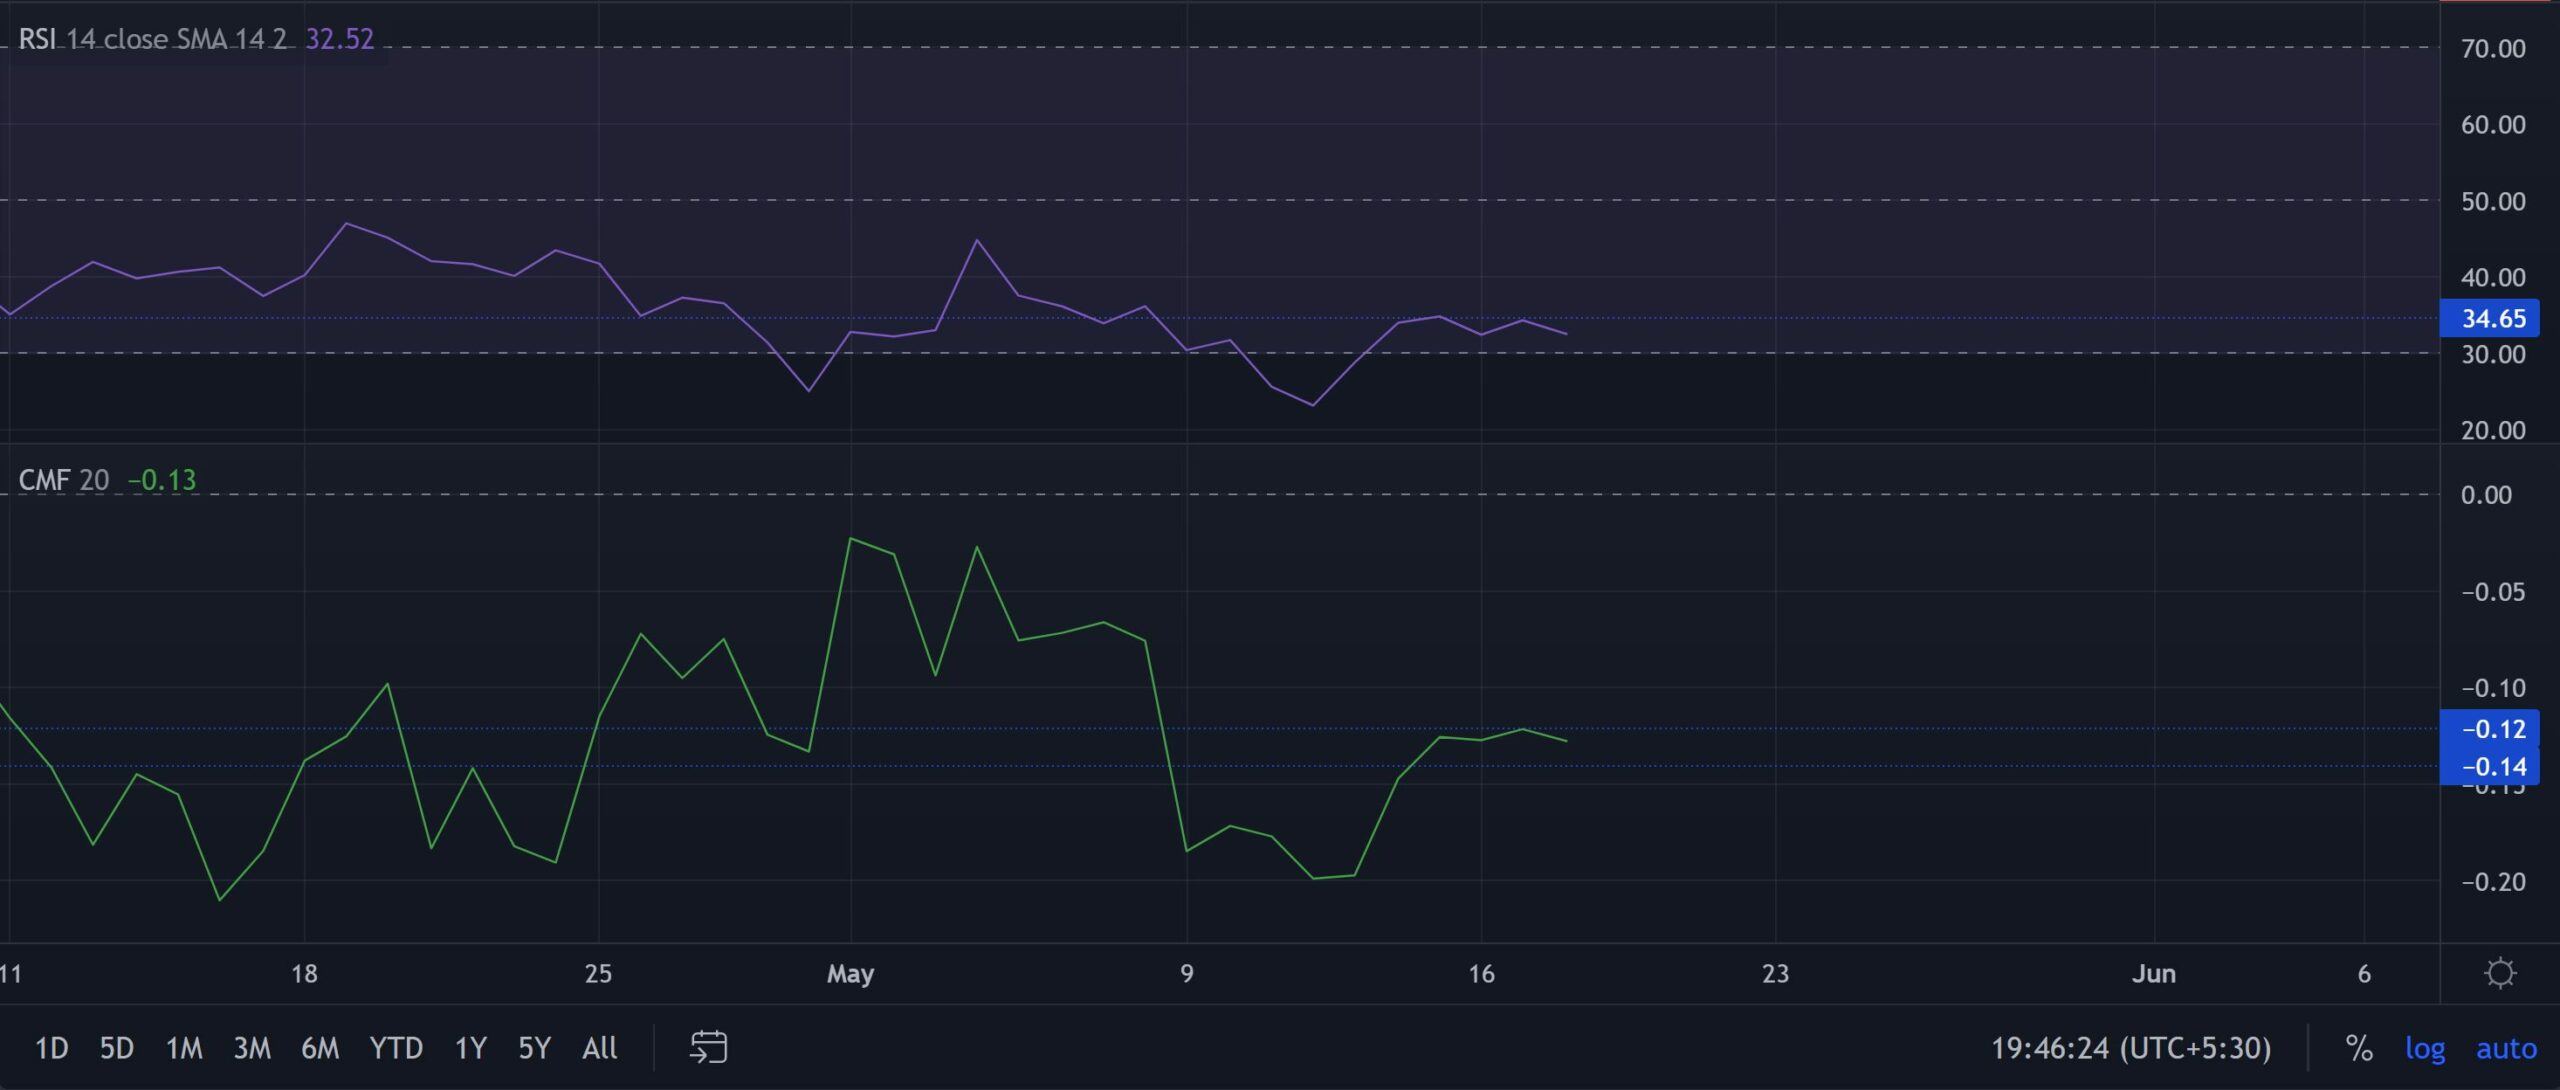
The Relative Strength Index suggested that sellers have a visible advantage in the current scenario. Failing to find an area above the 34-level, the buyers still have to drive the price to break its current bounds around the $1.3-$1.4 range.
The bearish CMF’s break above or below the current oscillation range could be critical in affirming a strong move on the charts.
Conclusion
In view of the barriers around the $1.3-$1.4 range, SAND could see a near-term slowdown on its charts. But, on account of an overextended reading on its EMA ribbons, the buyers would aim to push for more in the coming days.
Finally, the alt shares a 96% 30-day correlation with the king coin. Hence, keeping an eye on Bitcoin’s movement would be vital to complement these technical factors.