Analysis
VeChain, Chiliz, Ontology Price Analysis: 29 March
VeChain formed a range after the bullish performance in recent weeks. Chiliz saw massive swings in recent days but long-term traders would look for a climb past $0.6 to signal another leg upward. Ontology formed a bullish pattern and was likely to move to $1.66 once more.
VeChain [VET]
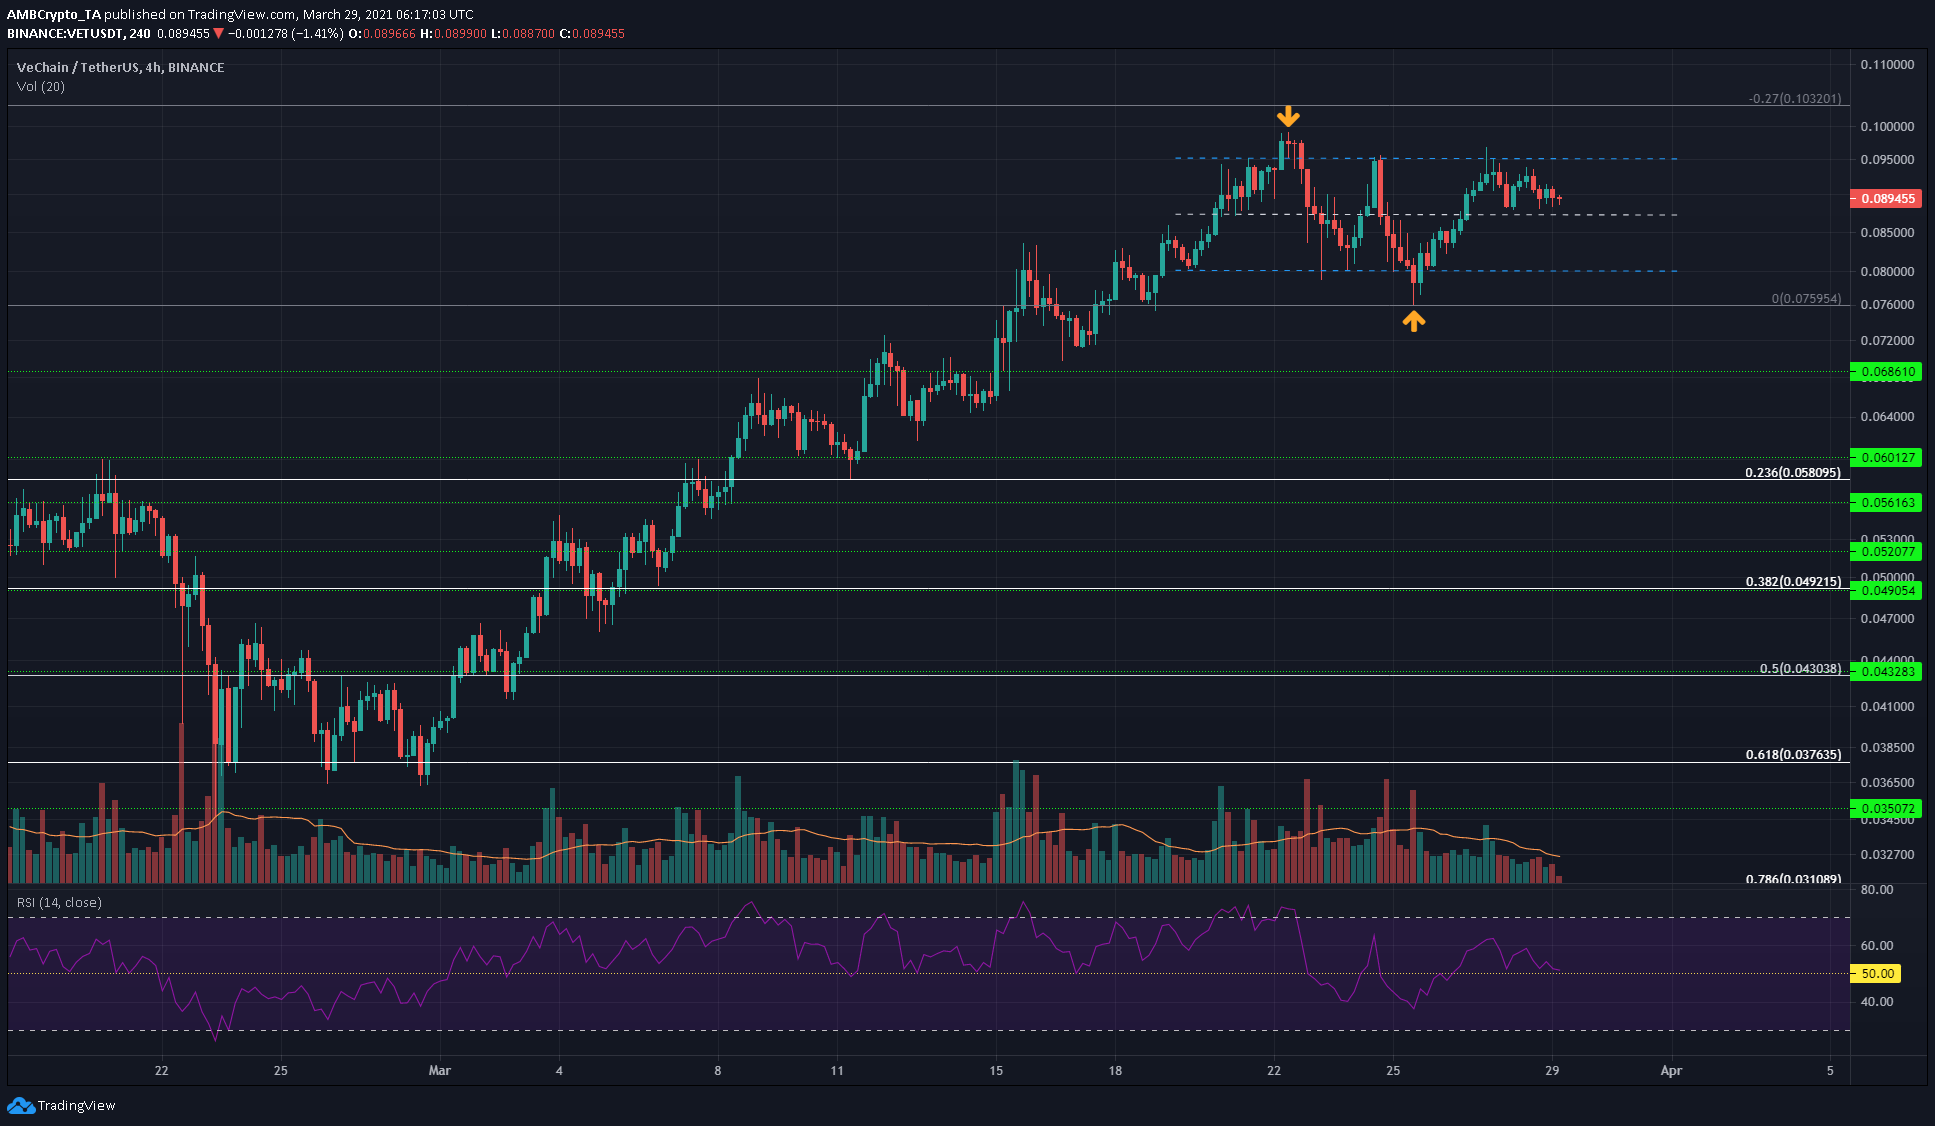
Source: VET/USDT on TradingView
After a strong performance in March, VET was consolidating in a range, whose boundaries lay at $0.08 and $0.093. Marked in orange are the deviations outside the range.
The RSI was above neutral 50, but showed waning bullish momentum in recent days, as the price approached the mid-point of the range. Closing a trading session below the $0.087 mark, that is, the mid-point of the range and retesting it as resistance can be used to enter a scalp short trade targeting the $0.08-$0.076 as take-profit. At that point, a long position can be entered if the range holds.
Chiliz [CHZ]
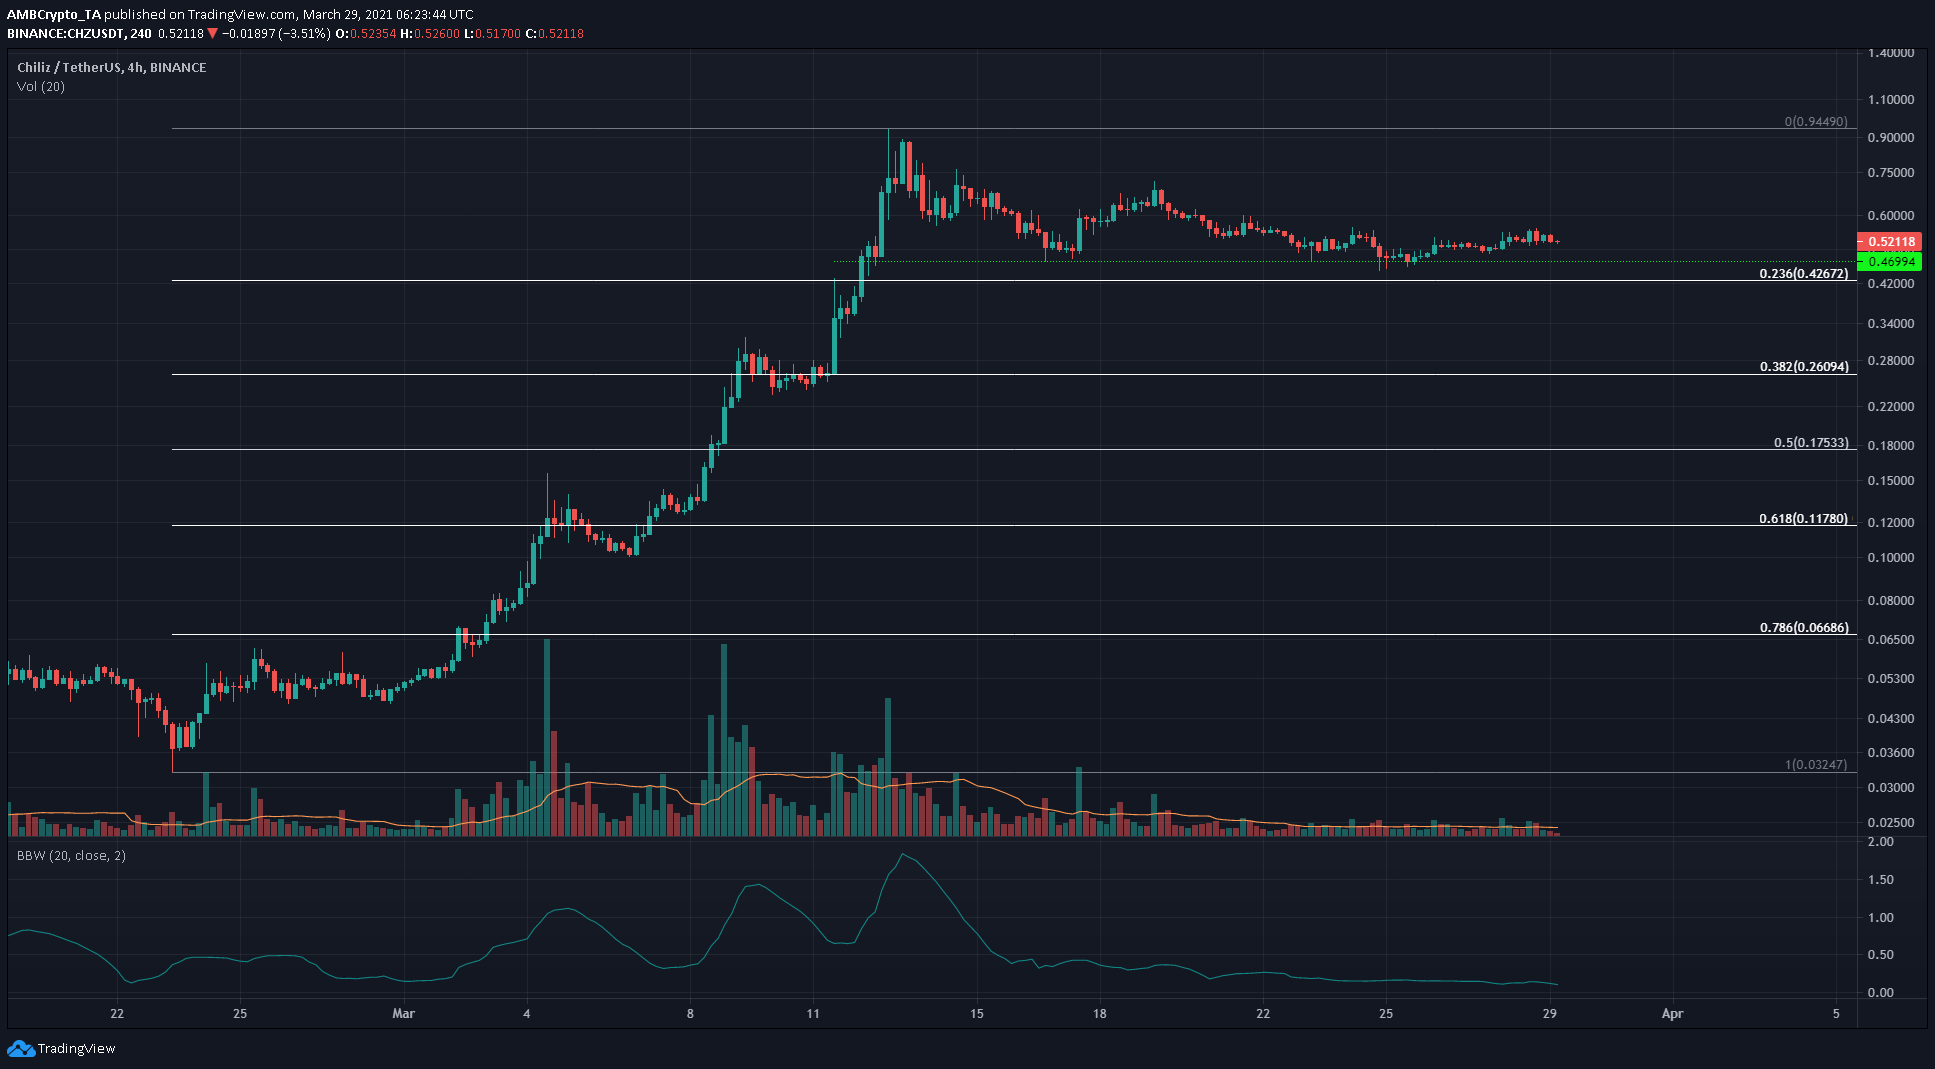
Source: CHZ/USDT on TradingView
Chiliz had a remarkable performance in March, surging from $0.032 to $0.94, amounting to 2820%. The 23.6% retracement for this move lies at $0.42, and there was also a level of support at $0.47 that CHZ was consolidating above.
The Bollinger Bands’ width indicator was very low on the charts to show significantly reduced volatility for CHZ on the 4-hour chart compared to its price action in recent weeks. The lower timeframes told a completely different story, as CHZ has made moves amounting to 50% and 30% within the past fortnight alone.
The $0.42-$0.46 region can be used to accumulate CHZ, or a longer-term trader can choose to wait for a deeper retracement. The $0.55-$0.6 has been a region of supply recently, and a breakout past this area can be a buying opportunity.
Ontology [ONT]
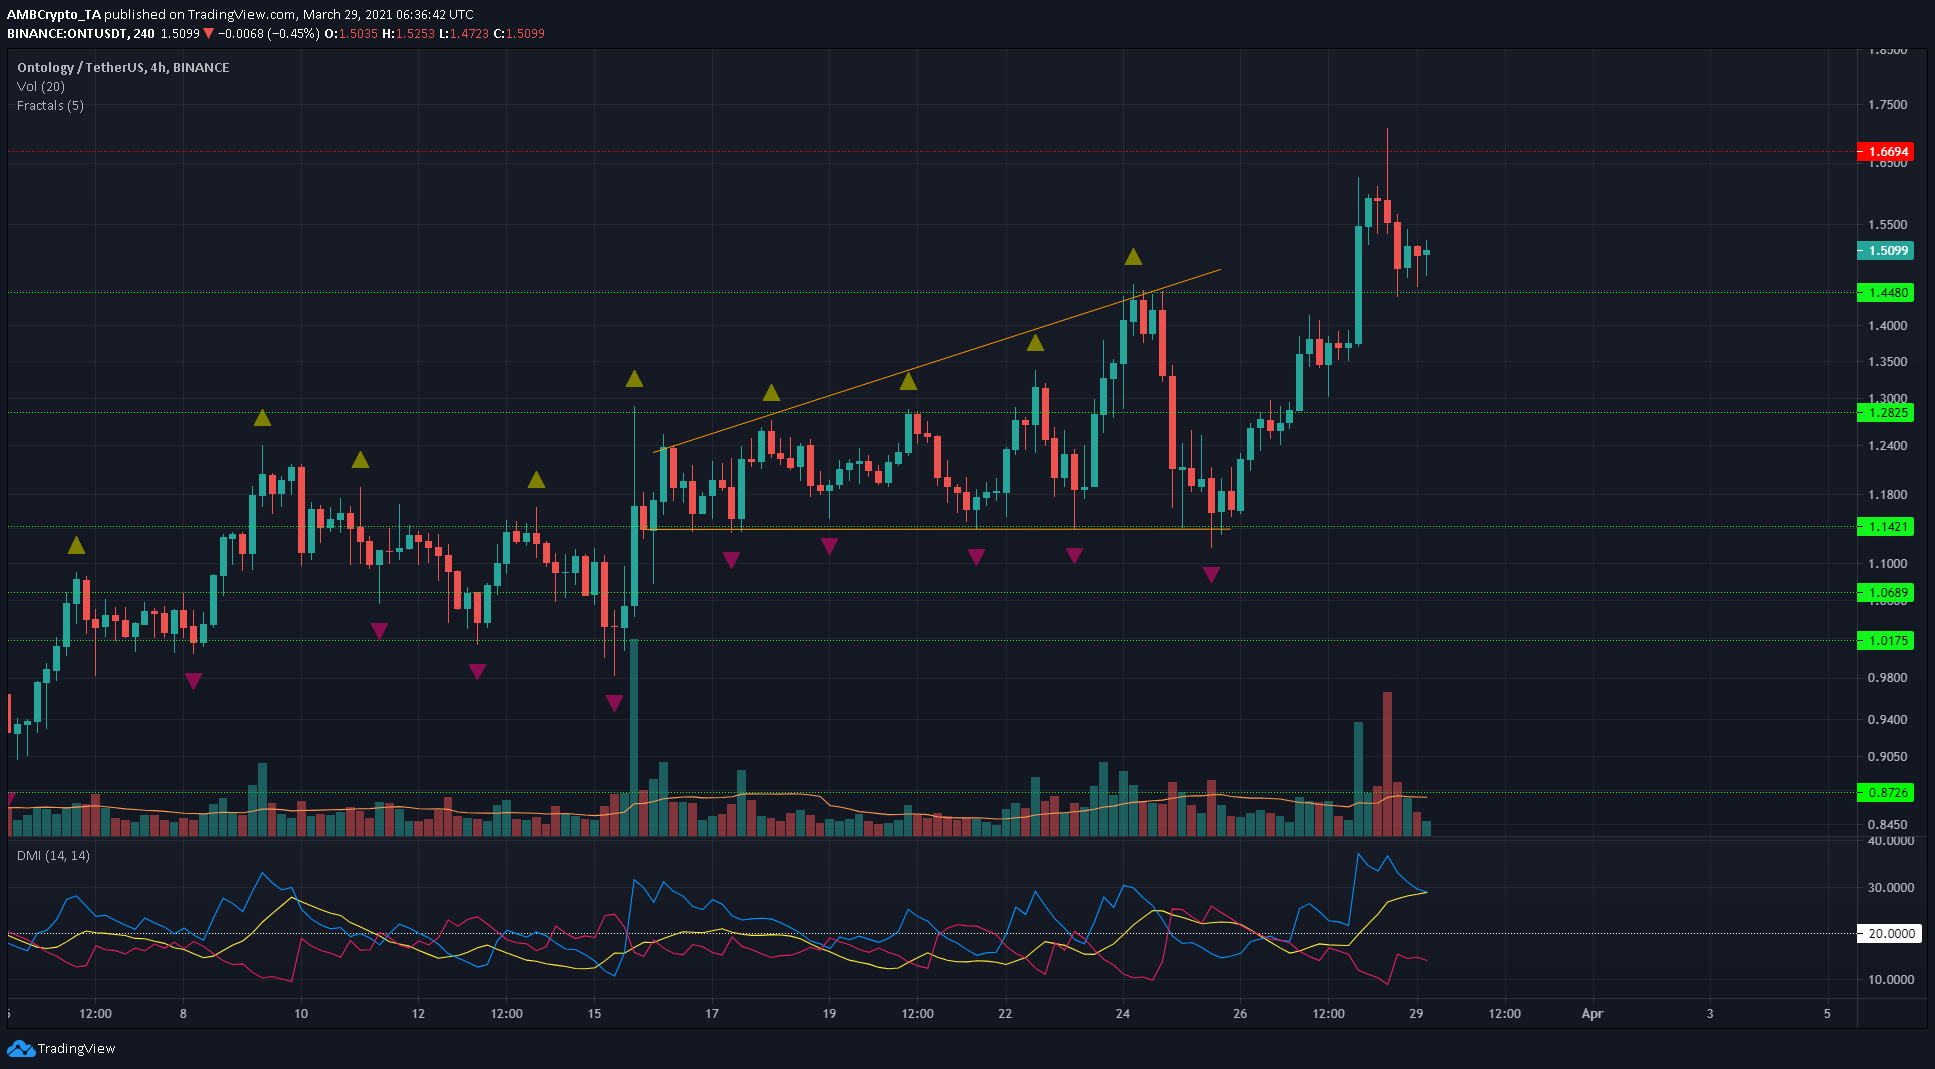
Source: ONT/USDT on TradingView
ONT had a clean right-angled, ascending broadening pattern form, and broke out past the $1.44 level and retested the same. This pattern has a projected target of $1.65 following the breakout past $1.44, and it can be seen that there is a level of resistance at $1.66, making it a take-profit level.
At the time of writing, the throwback to $1.44 had already played out- this point was an optimal trade entry. The Directional Movement Index showed a strong upward trend in progress.